5556
5556
Introduction
The Action Center tab displays a variety of charts and metrics providing an at-a-glance view of your organization.
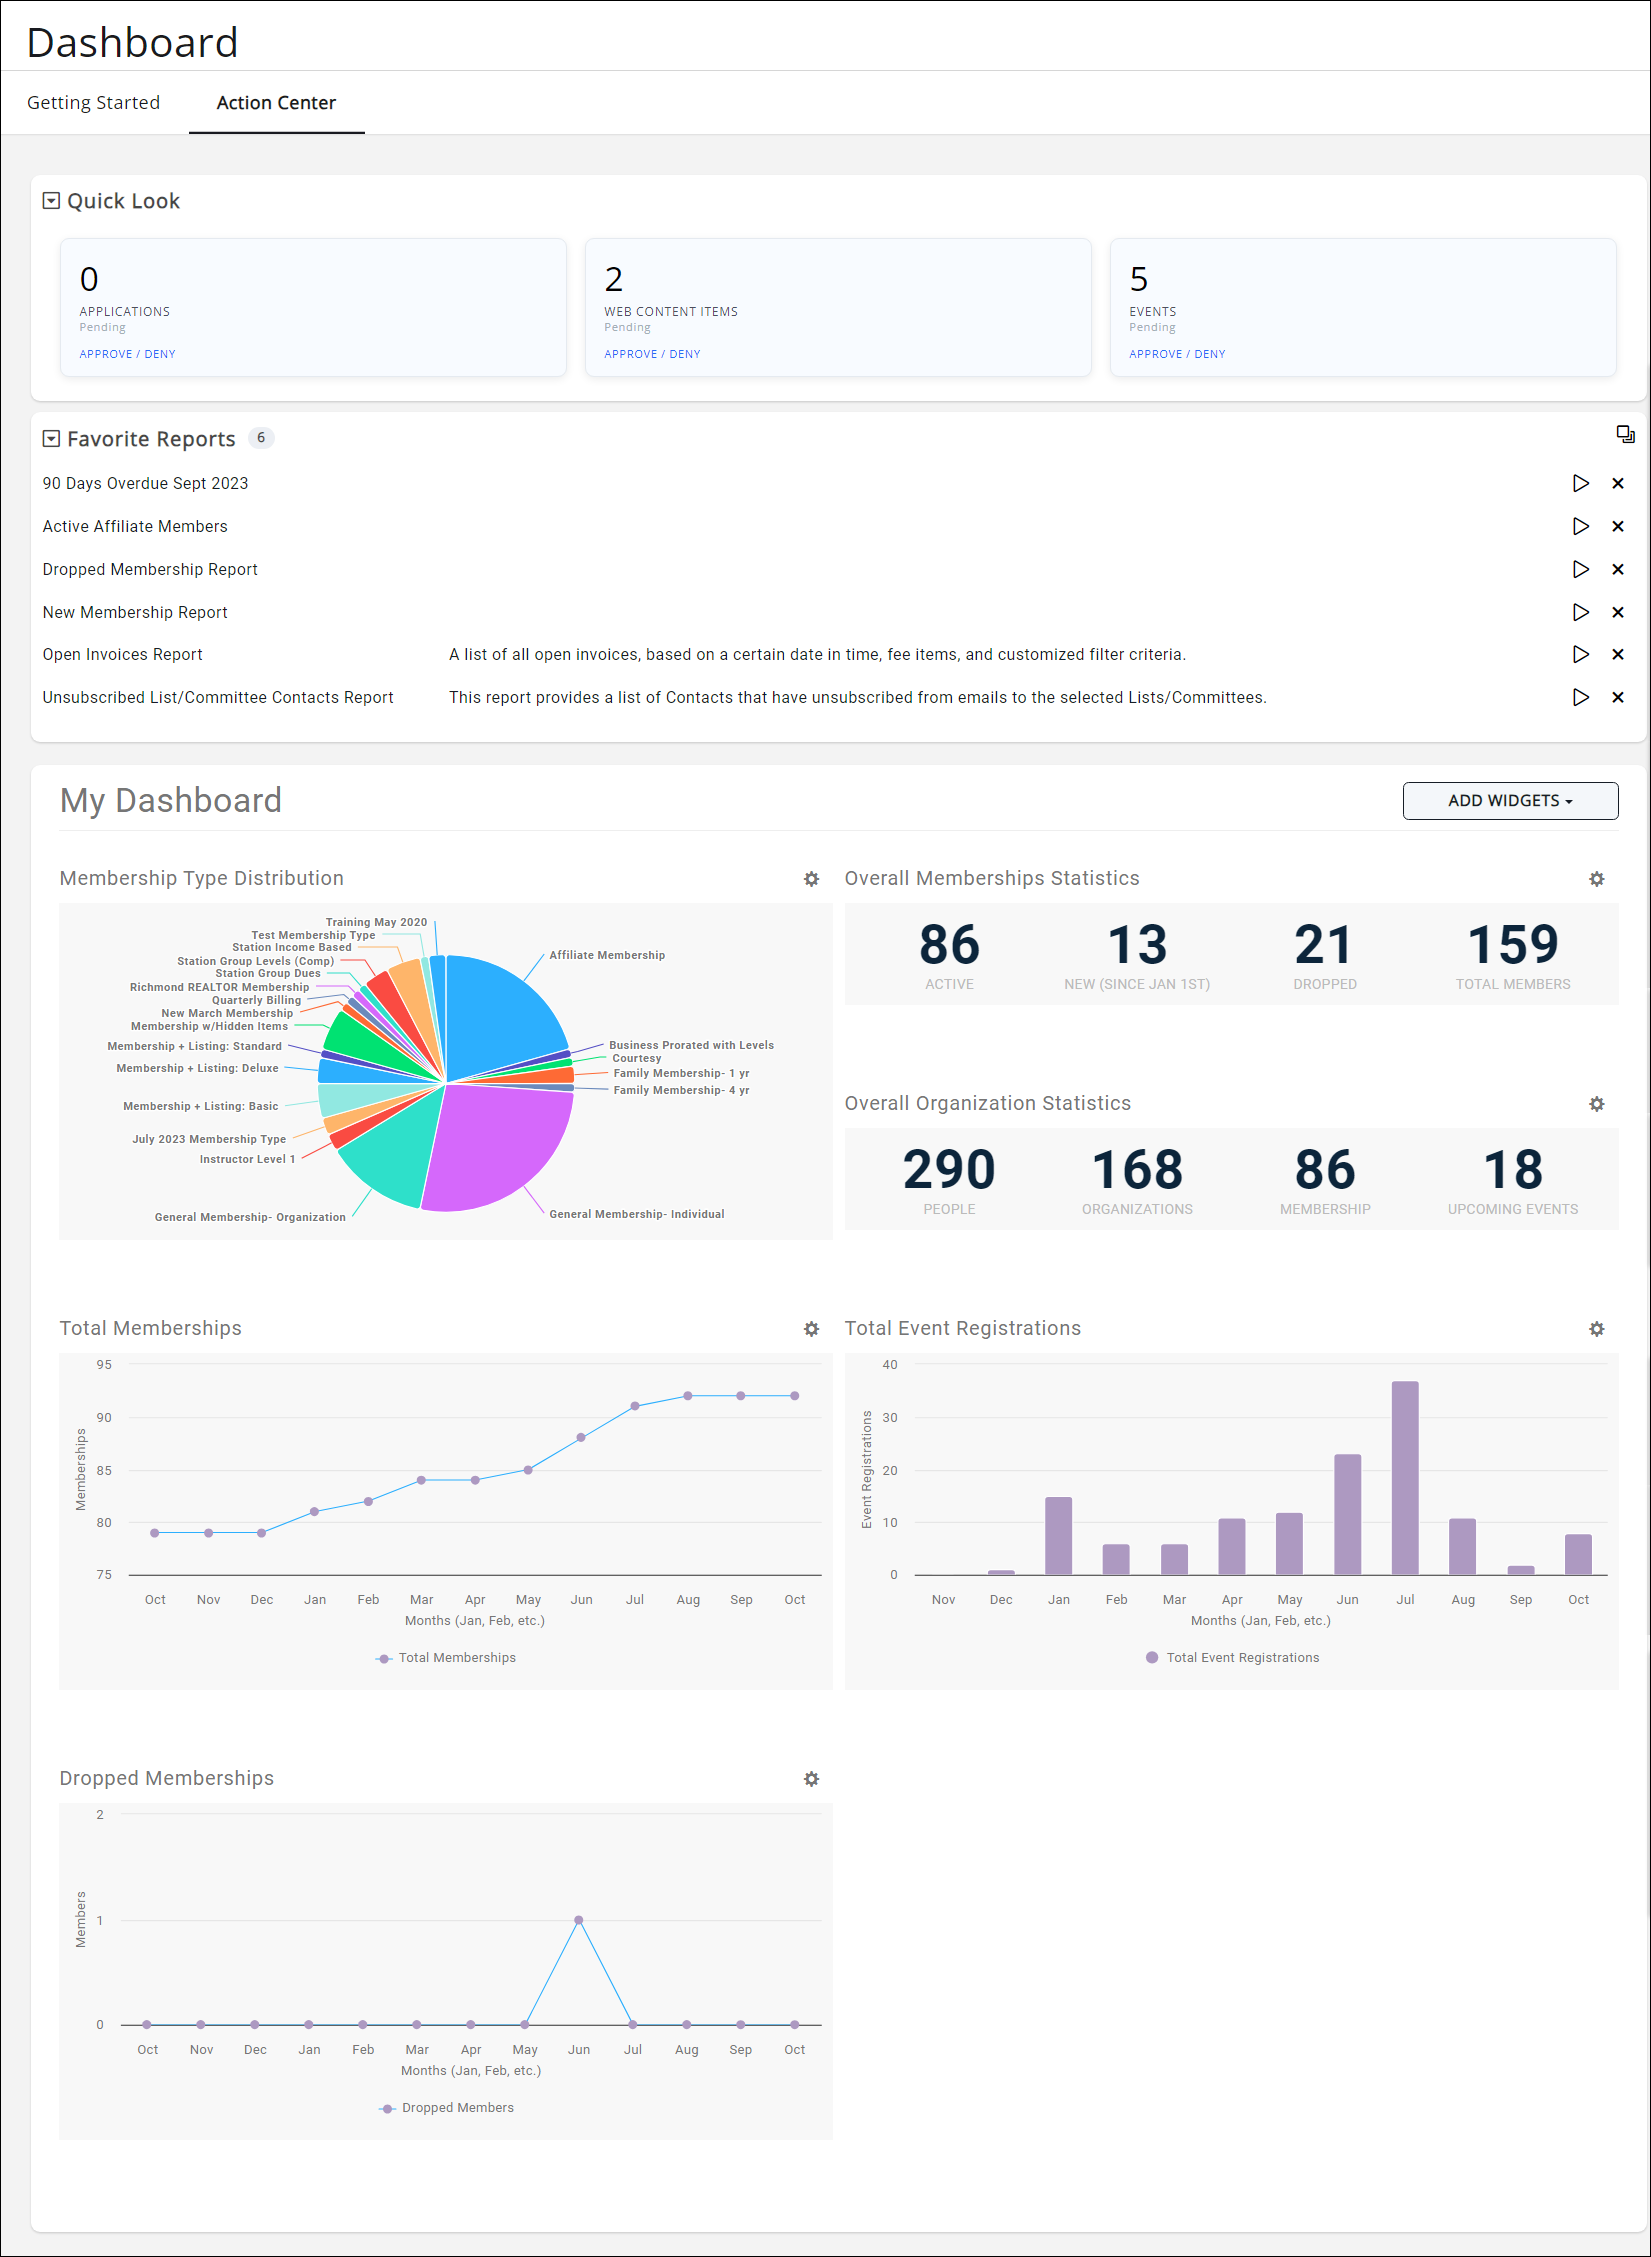
Table of Contents
- Quick Look and Favorite Reports Widgets
- Metric Widgets
- Where do the Widget Metrics Come from?
- Memberships by Owner Type
- Overall Organization Statistics
- Overall Memberships Statistics
- New Memberships
- Dropped Memberships
- Membership Type Distribution
- Total Event Registration
- Sales Win by Month
- Sales Funnel Statistics - Current Year
- Total Memberships
- Wins by Sales Person
- Membership Categories
- Fundraising Statistics - Current Year
- Sales Velocity
- Related Articles
Quick Look and Favorite Reports Widgets
The Quick Look
The Quick Look widget makes it easy to know whether incoming items need your attention.
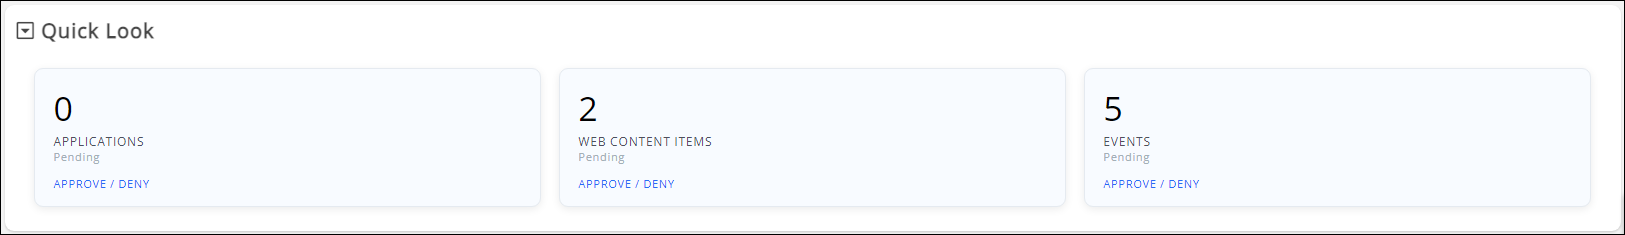
Pending Membership applications, Web Content items, and submitted Events will display here for those who have permissions to approve them. Simply click the blue Approve/Deny link to be taken to the location where you can review and approve these items.
The Favorite Reports
The Favorite Reports widget will display a list of your favorited reports.
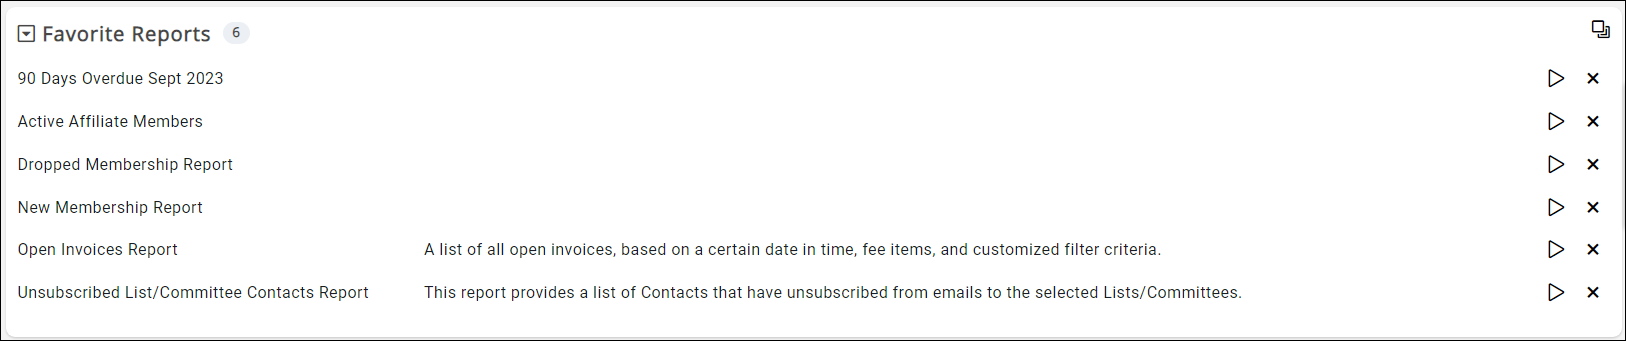
- To access them, simply click the "play" icon
 for the report you wish to run. The report will open and you can adjust any settings/criteria before clicking "Run Report".
 - If you no longer need it as a favorite, click the "X" icon
 to remove the report.
 - To add a new favorite report to the widget:
- Go to your Reports module in the left-hand menu or click the "Go to full list" icon.
- Find the desired report, open it, and select "Add as a Favorite Report". It will then display in the Favorite Reports widget.
Metric Widgets
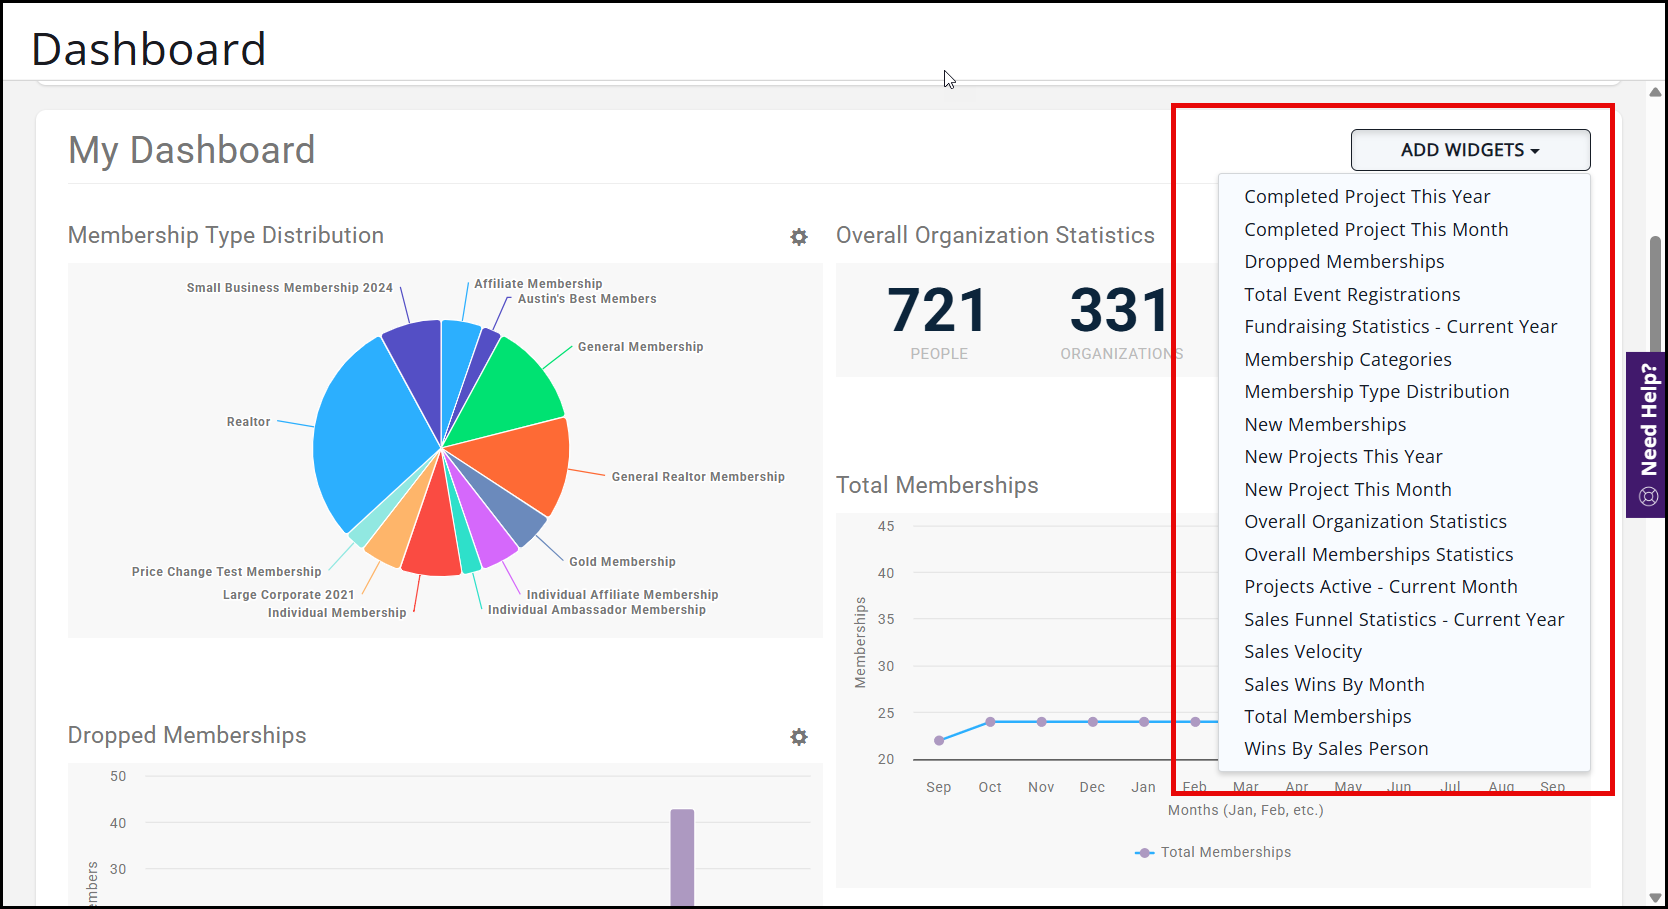
Most widgets allow you to modify the settings for the widget, such as the name of the widget, the duration of the widget, the graph type of the widget's metrics, and more.
Widget settings will vary per widget. You can customize the display and placement of these widgets on your Dashboard according to your needs; each person's Dashboard is unique.
Where do the Widget Metrics Come from?
We are looking at where the statistics come from when you select a widget to display on your dashboard.
As the widgets can be customized per person, these examples are tailored to the base widget without filters.
Memberships by Owner Type
- The Dashboard includes a widget that quickly shows how many memberships are held by Individuals and Businesses, and the number of individuals under each Business. This is for Associations who are trying to increase their business and individual membership counts with a quick glance.
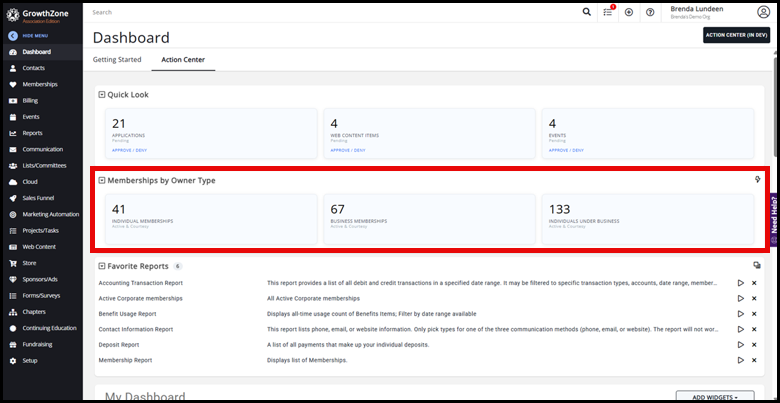
- This widget automatically displays, but can be collapsed by clicking the down arrow in the upper-left corner of this widget. To re-display this widget, click the up arrow in the upper-left corner of this widget to bring it back up at any time.
- This is the only widget that has counts specific to the breakout between individuals and businesses.
- To see where the numbers that are displayed on this widget come from:
- Individuals: Use the Memberships report. Filter the report by 'all Individual Membership types' and Active status. Include Courtesy if the filter on the widget includes Courtesy.
- Businesses: Use the Memberships report. Filter the report by 'all Business Membership types' and Active status. Include Courtesy if the filter on the widget includes Courtesy.
- All Individuals under Business: Use the Members report. Filter the report by 'Individual Contact Type' and Active Status. Include Courtesy if the filter on the widget includes Courtesy. Select Business Membership Types. Set CRM Type = InCRM.
 Important Tips:
- Early adopters using this widget found it helpful to mark a Membership Report and Members Report filtered to the same options as the widget, so they could quickly drill into the names and contact info of who belongs in that breakout. This is our best recommended practice for this widget.
-
To see an easy-to-use list of the individuals grouped under their business, run the Memberships report, filtered to Individual Contact Type, select all membership types, status = Active (and Courtesy if filter includes Courtesy) status, all Membership types selected, and make sure to include Primary/Contact Name.
-
If an individual belongs to multiple memberships, they will only count 1x in the widget. The idea is that this shows the reach you have into your demographic.
-
Watch out for contacts included in a membership but marked as NotInCRM. Typically, you'd want to convert them to a Contact. Then, if it is a duplicate contact, you can proceed with a merge.
Overall Organization Statistics
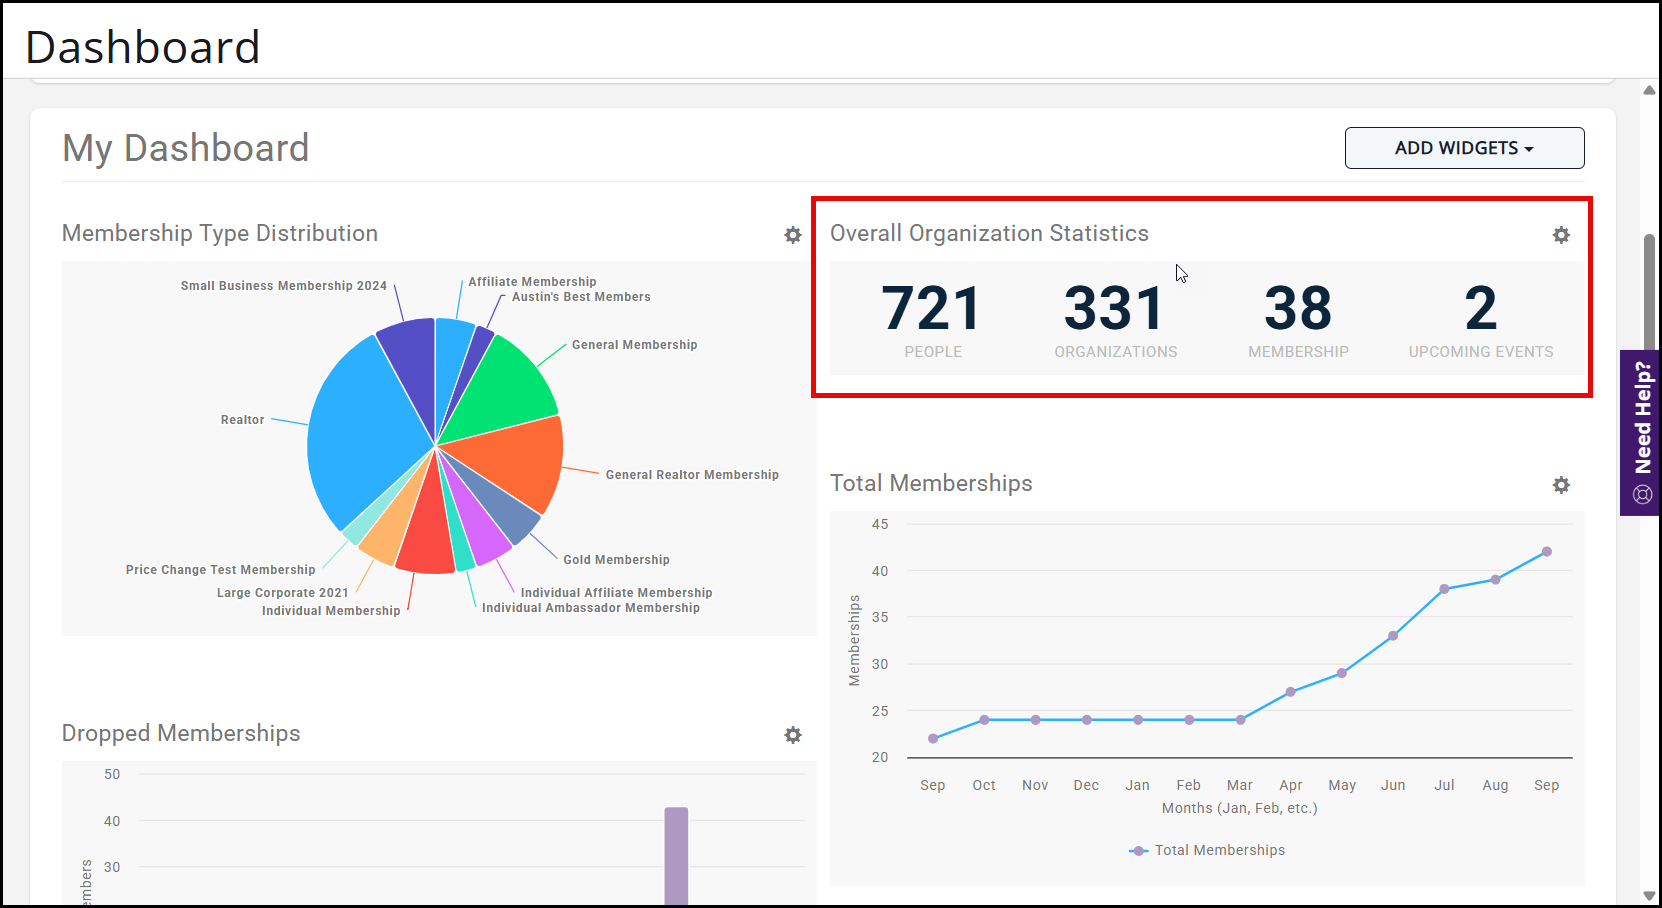
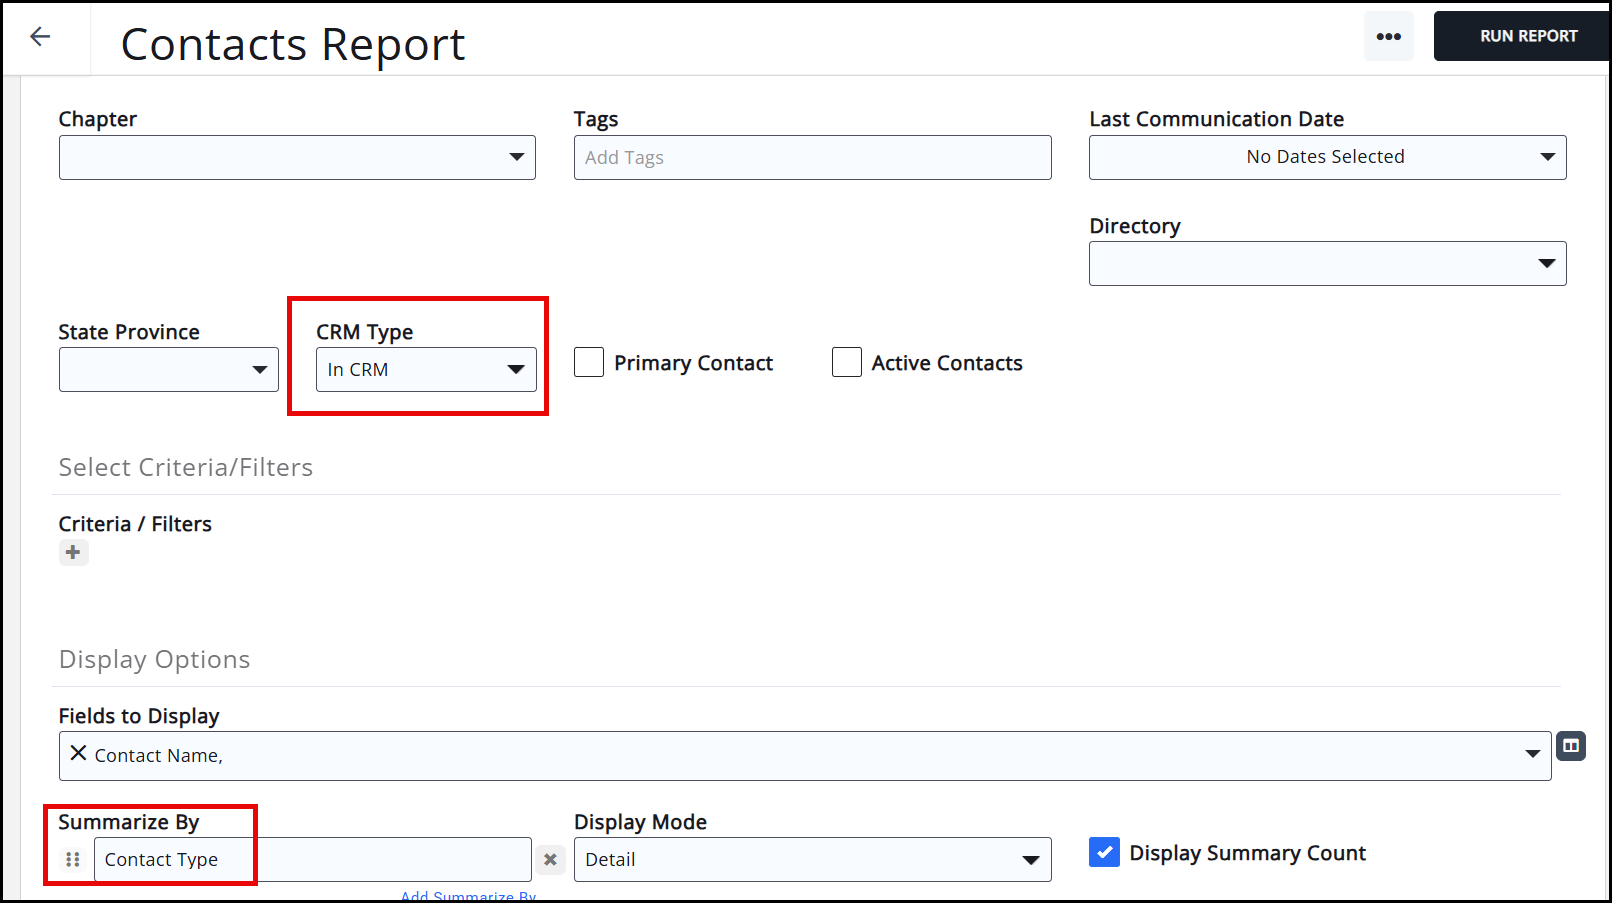
- The People and Organizations statistics come from the Accounts/Contacts Report. To see this statistic, you will need to set the CRM Type to In CRM and the Summarize By display option to Contact Type. The People statistics come from the Individual Count under Results, and the Organizations statistics come from the Organization Count under Results.
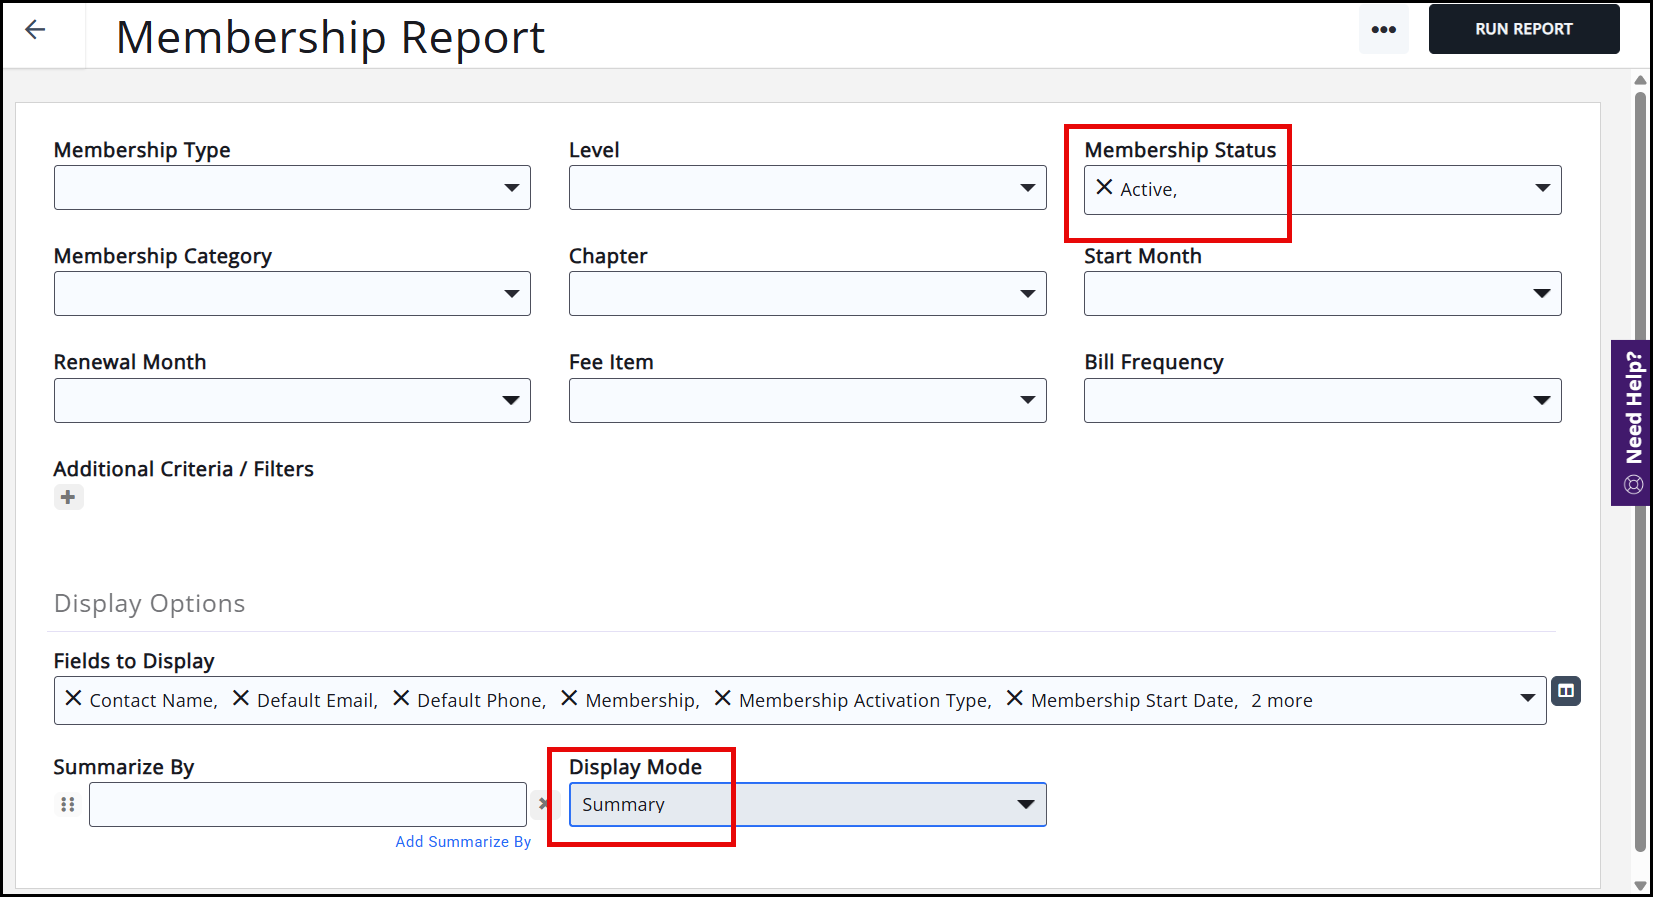
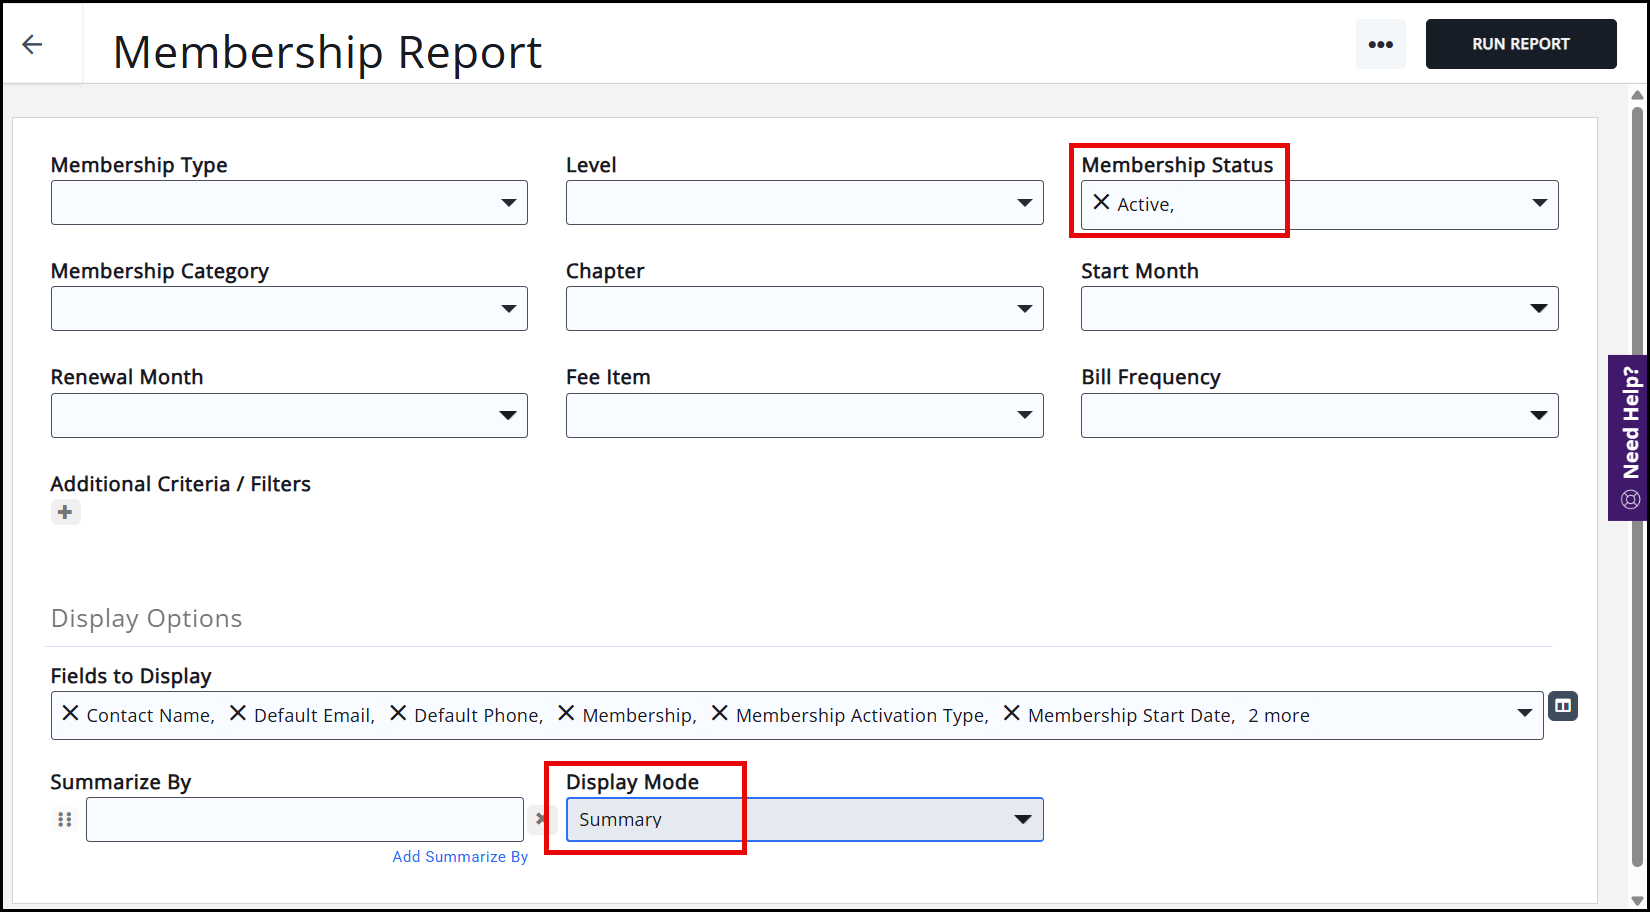
- The Membership statistics come from the Membership Report. To see this statistic, set the Membership Status to Active and the Display Mode to Summary. The Count shown under Results will give you the Membership statistic. This statistic is evaluating total active memberships, not members. If you are expecting to see number of members equal number of memberships and they do NOT, you may have multiple memberships on a contact record OR parent/child relationships inheriting status.
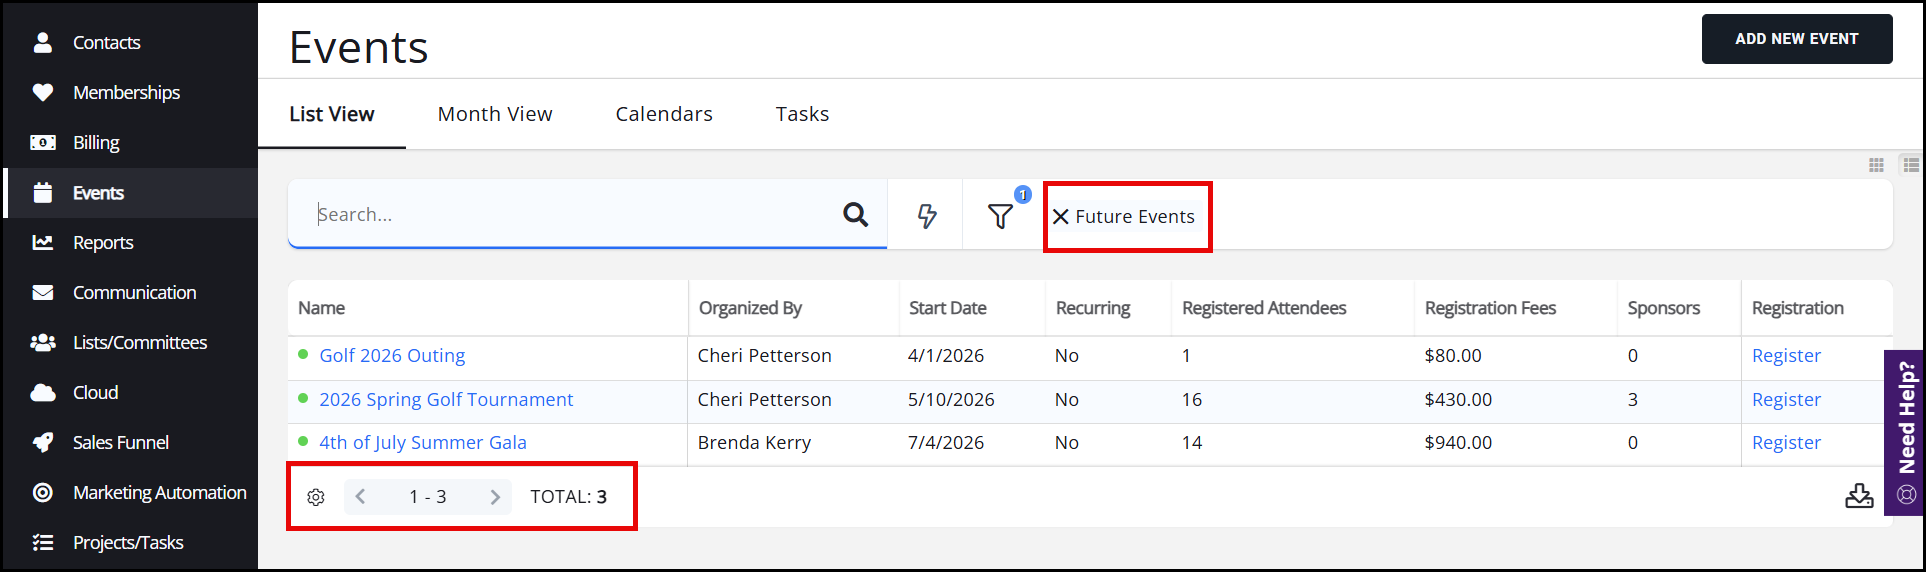
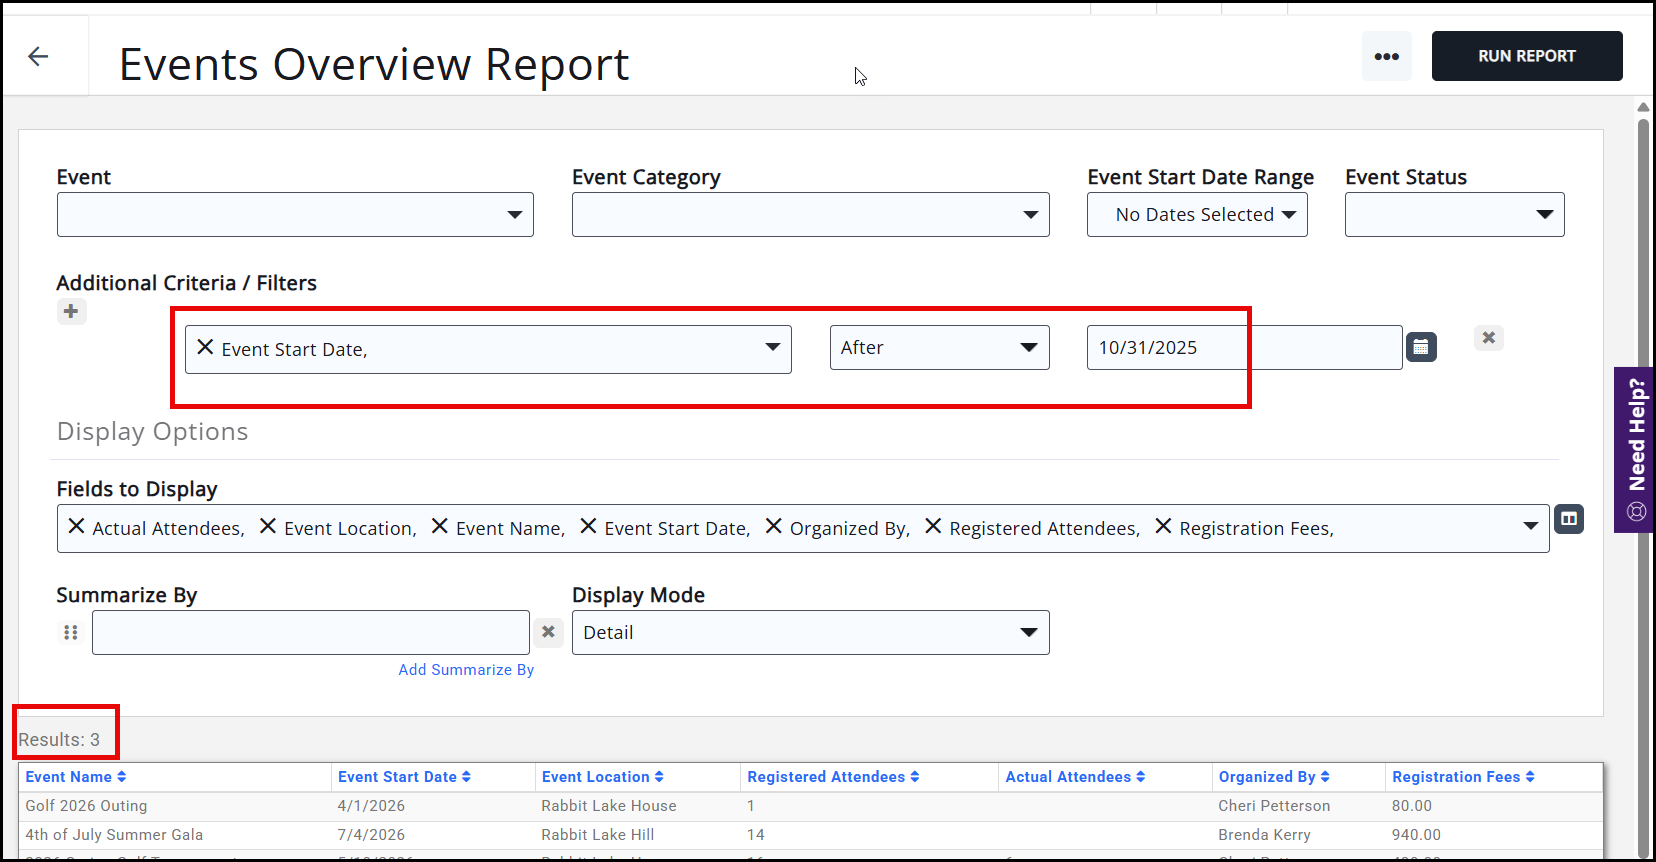
- The Upcoming Events statistics come from your total number of Future Events. This can also be seen under the Events Overview Report when the Additional Criteria/Filters are set to Event Start Date, After, and the current date.
Overall Memberships Statistics
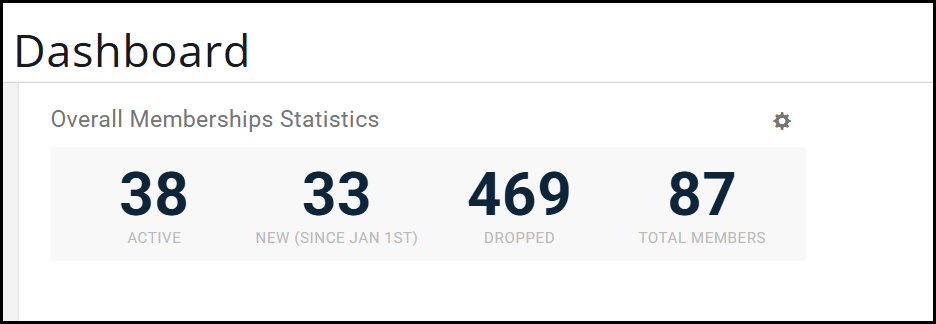
- The Active statistics come from the Membership Report. It reports on the Active status of members, and you can see this number by setting the Display Mode to Summary.
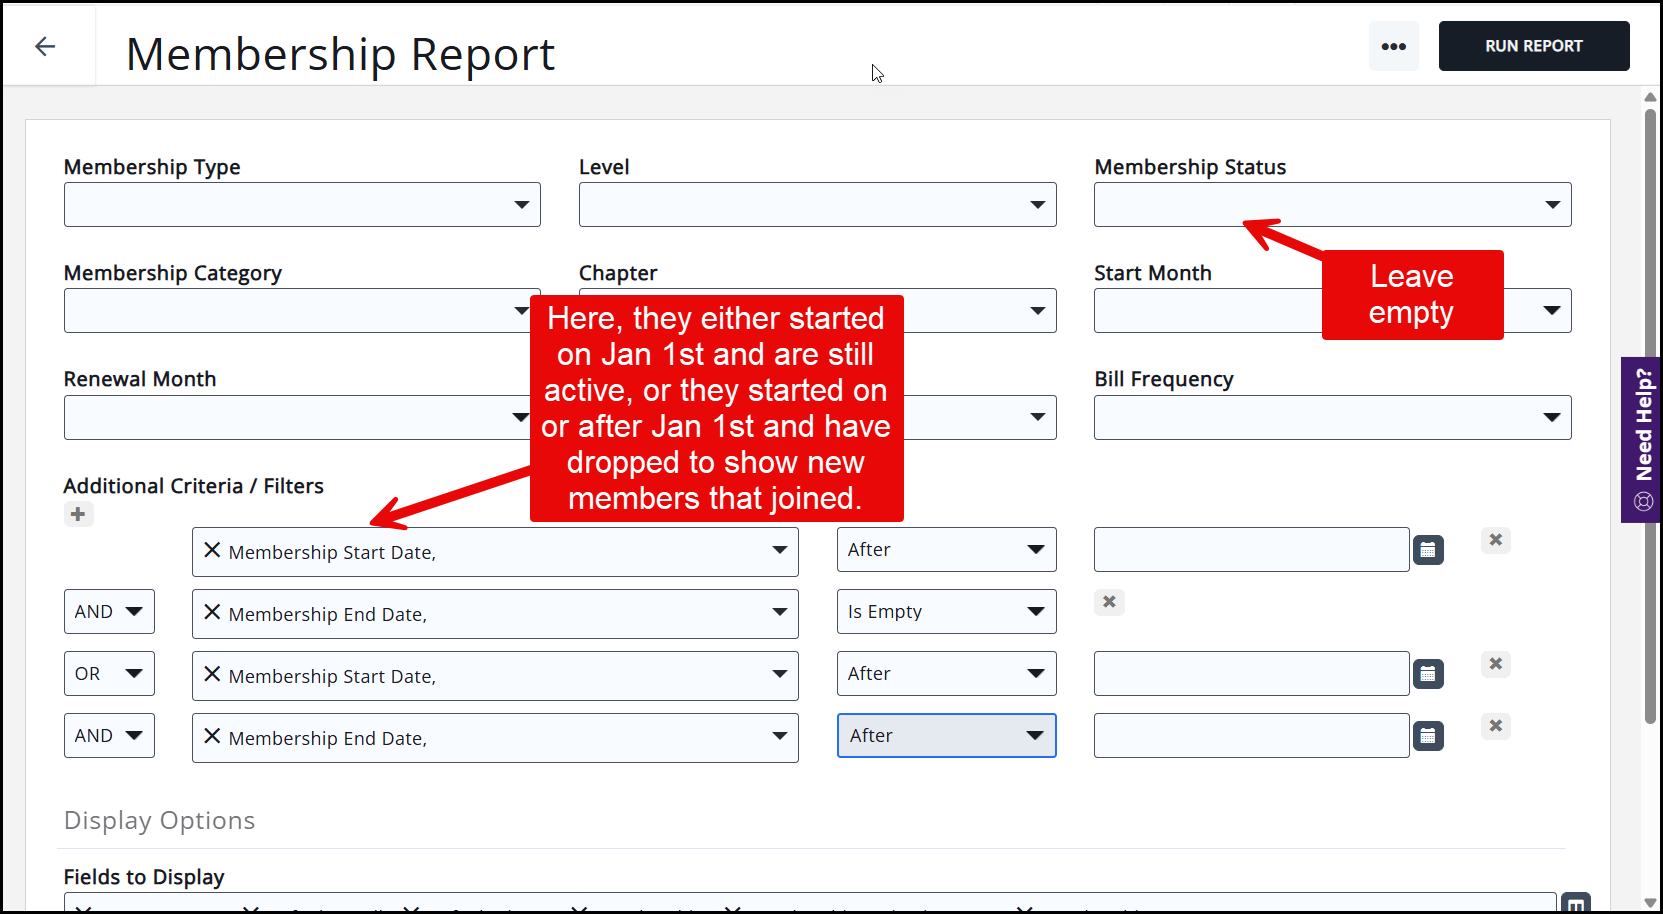
- The New statistics come from the Membership Report. To see this statistic, leave the Membership Status empty and set the Additional Criteria/Filters to new members who have joined in the year you are evaluating. This includes members who either started on or after January 1st and are still active members , OR members who started on or after January 1st and have dropped their membership.
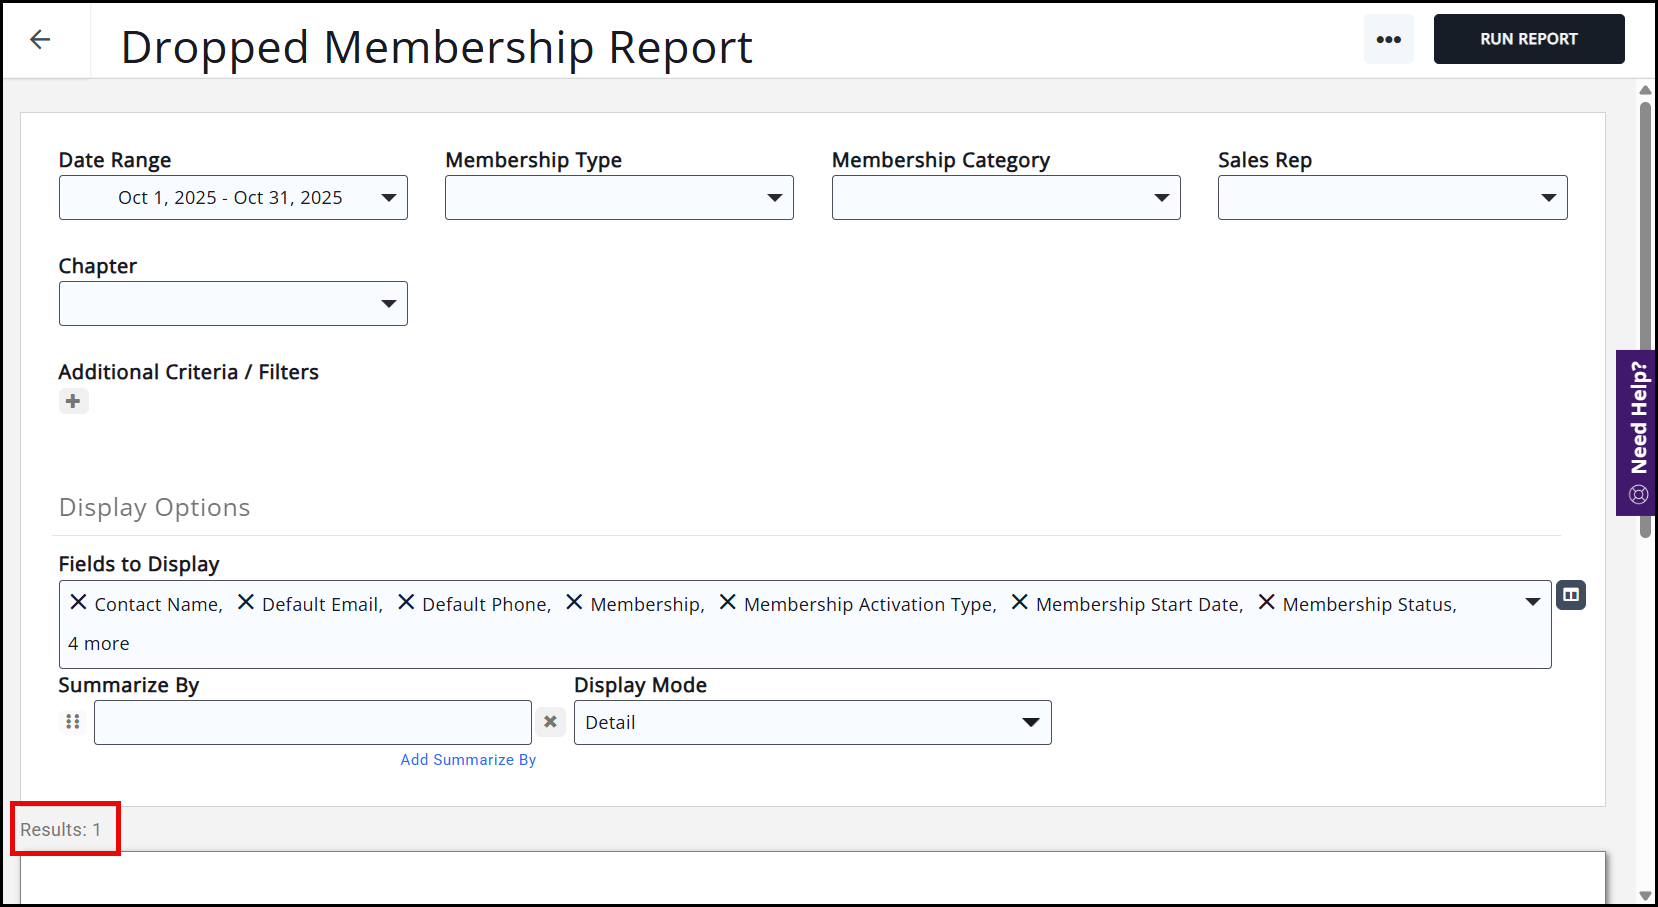
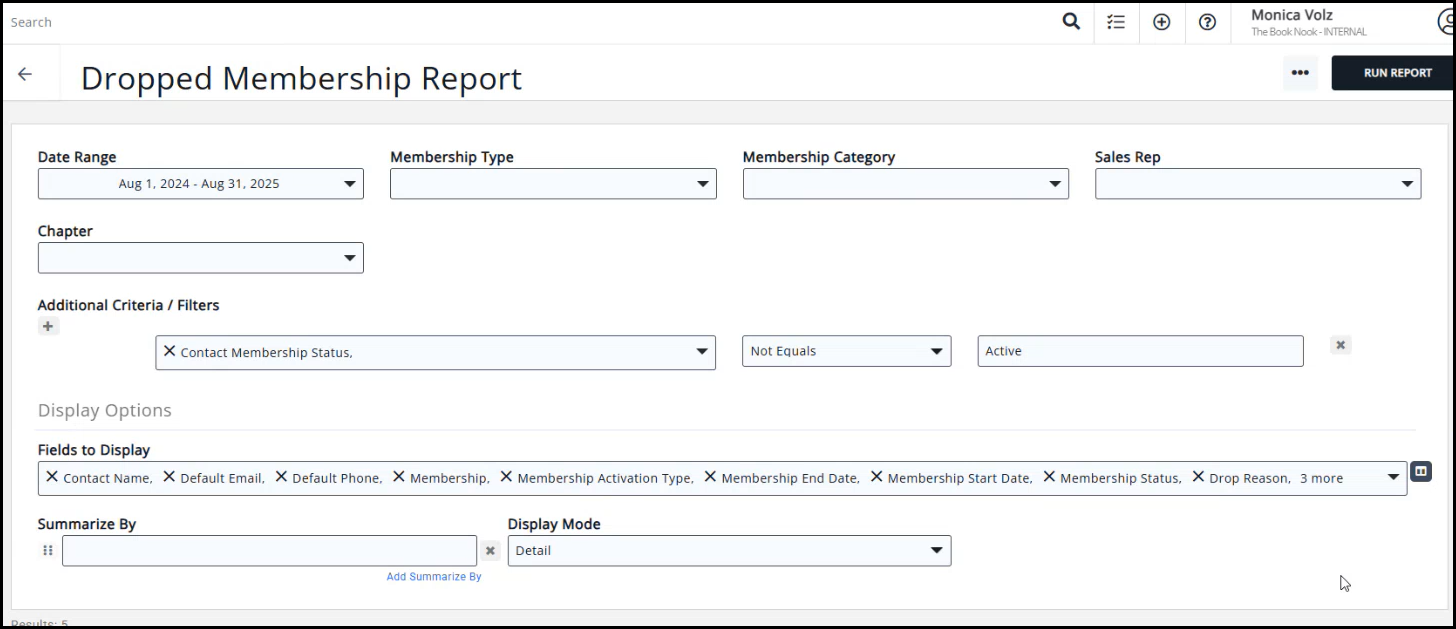
- The Dropped statistics come from the Dropped Membership Report.
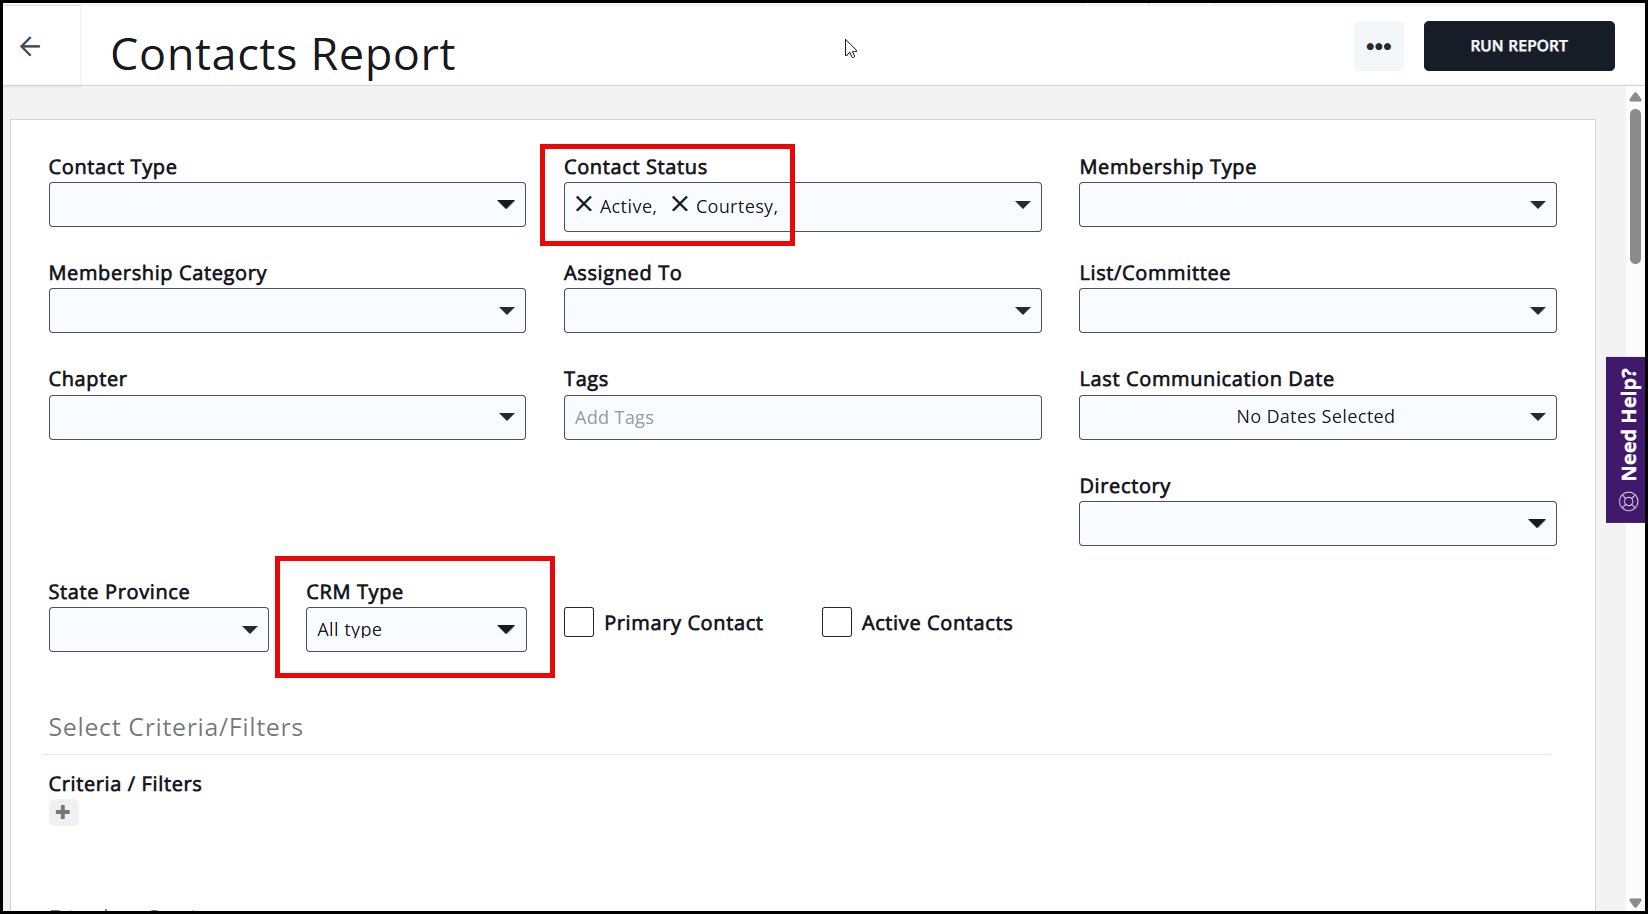
- The Total Members statistics come from the Contacts Report. To view this statistic, set the Contact Status to Active and Courtesy. You will also need to set the CRM Type to All Type.
New Memberships
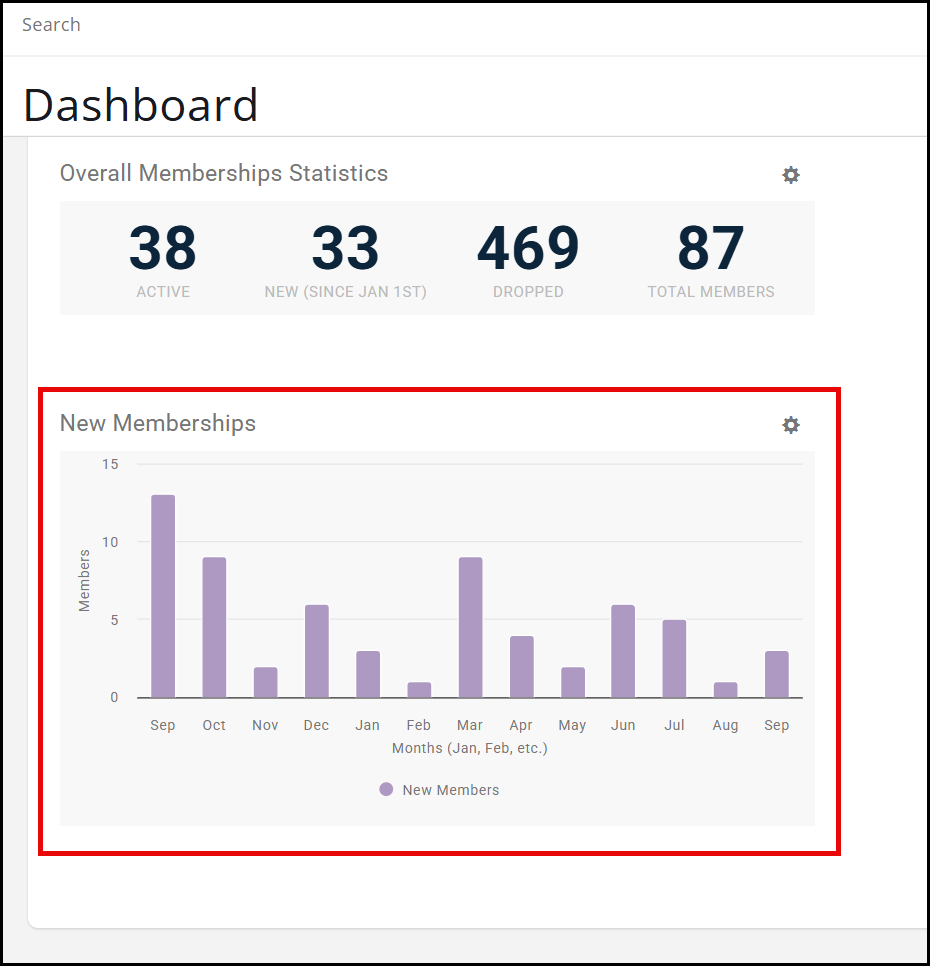
- The graph shown here is based on your New Membership Report. The New Membership widget is based on the New Membership Report with the same date range. The activation type may be misleading if you have since made changes to it; however, the overall statistics for New Membership are based on the start date.
Dropped Memberships
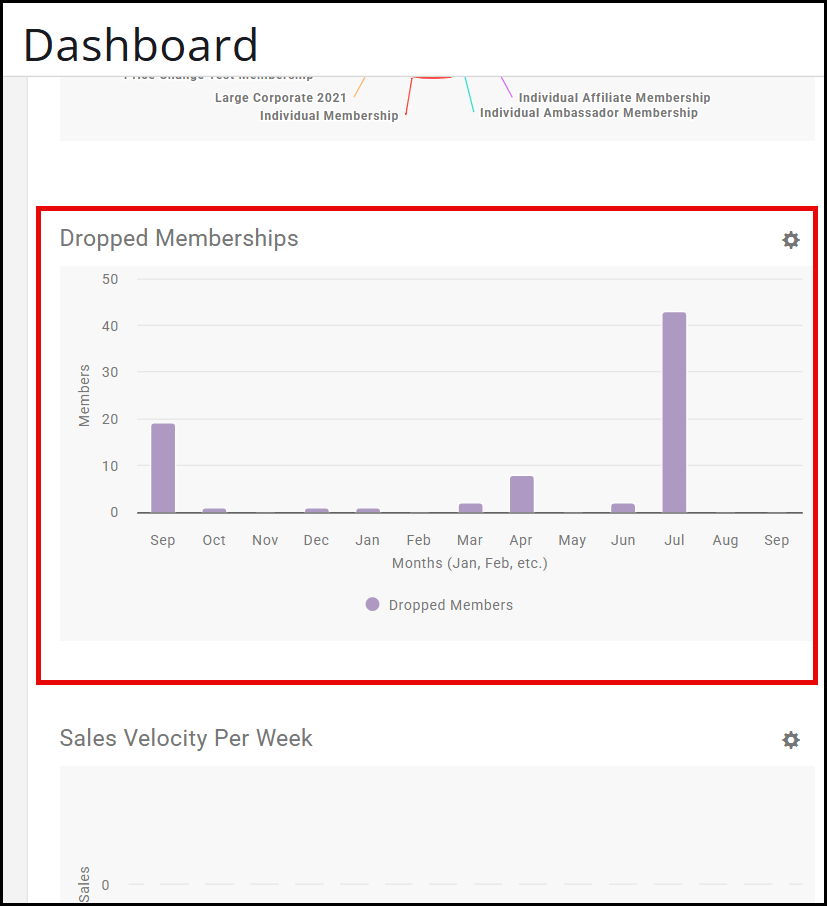
- The graph shown here is using information from the Dropped Membership Report. Please note that the Dropped Memberships widget recognizes memberships that you have dropped where the corresponding Contact Record is no longer active.
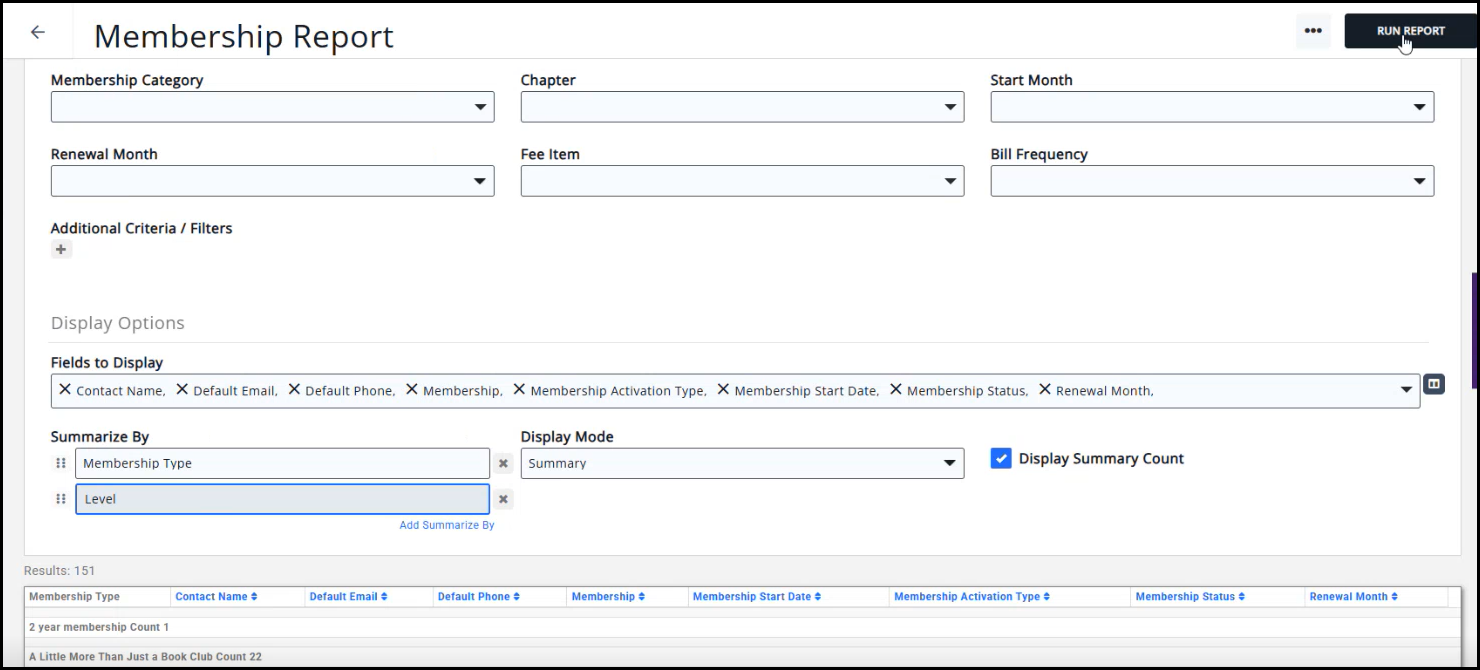
Membership Type Distribution
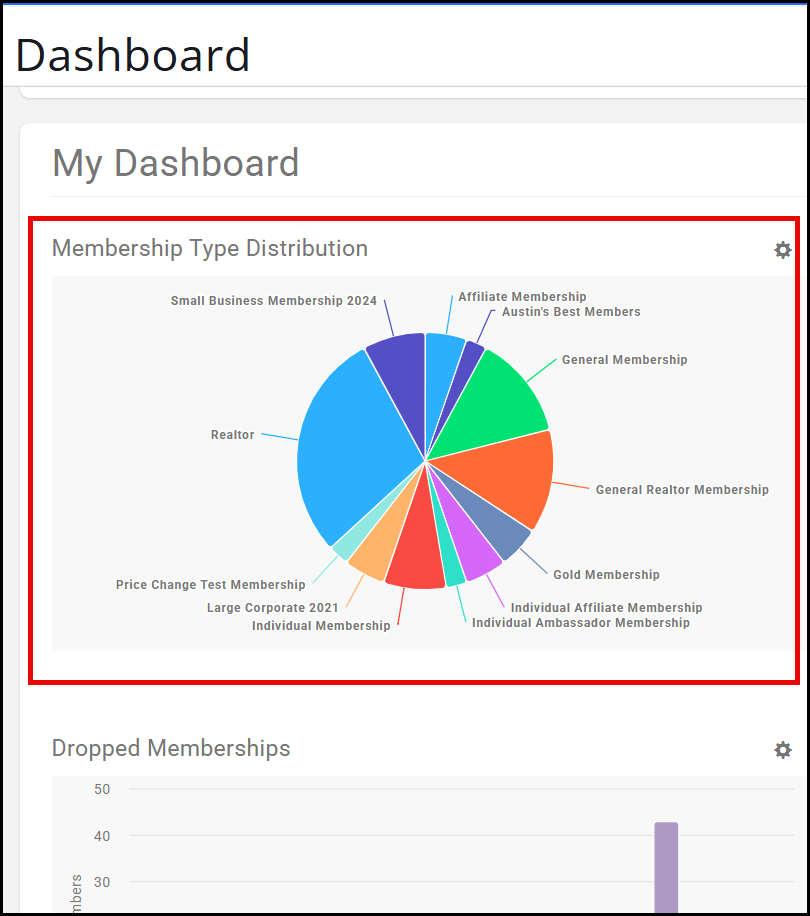
- Membership Type Distribution pulls statistics from the Membership Report. You can also include courtesy memberships by selecting to include this option in your widget, as well as in the Memberships Report. We recommend summarizing the Membership Report by Type for the best information on your statistics.
Total Event Registrations
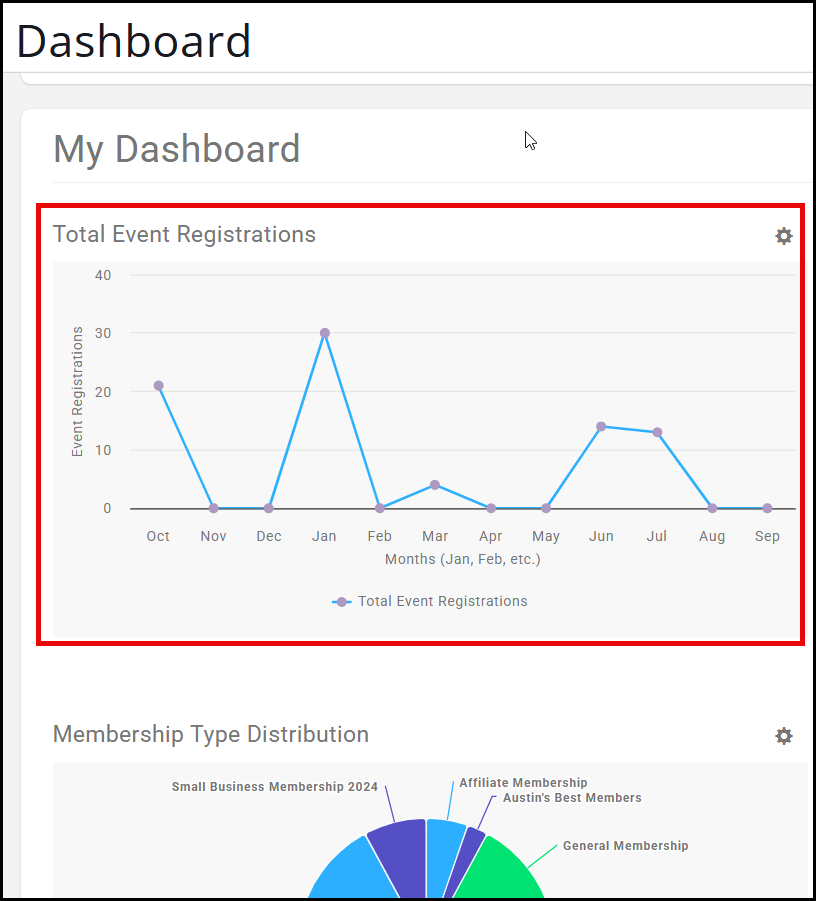
- Total Event Registrations shows the 12-month statistics from the Event Attendees report. You can filter this widget by Category or specific event by clicking on the gear icon on the top right of the widget.
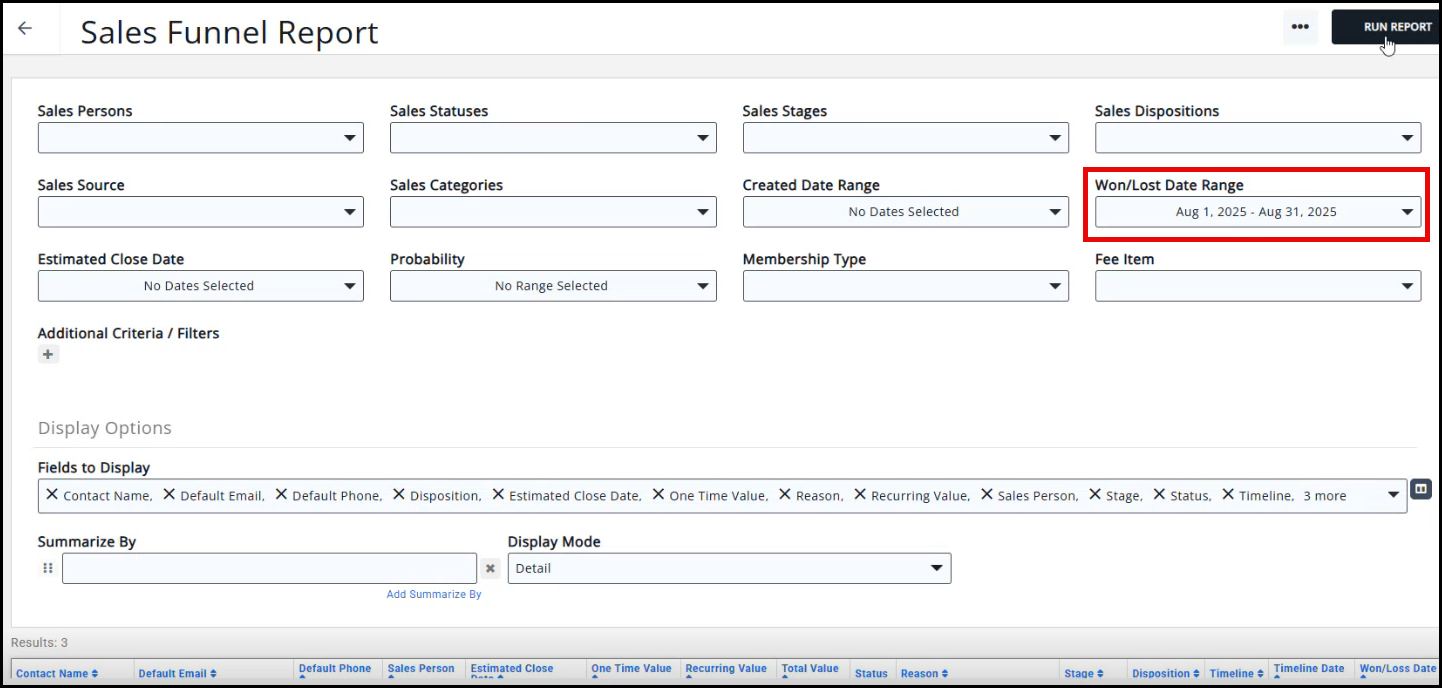
Sales Win by Month
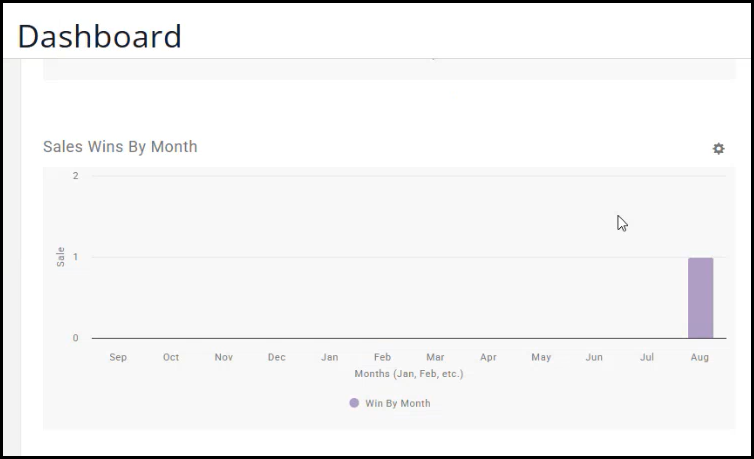
- To find this statistic, you will use the Sales Funnel Report, and you will set the Won/Lost Date Range to 'This Month'.
Sales Funnel Statistics - Current Year
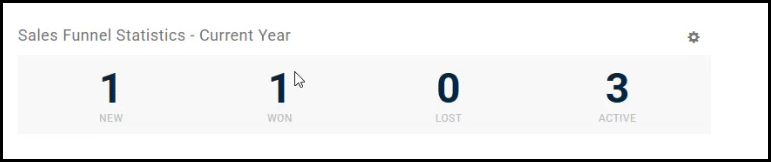
- Sales Funnel is also sometimes referred to as 'Member Recruitment'.
- Sales Funnel Statistics utilizes the Sales Funnel Report to display the statistics.
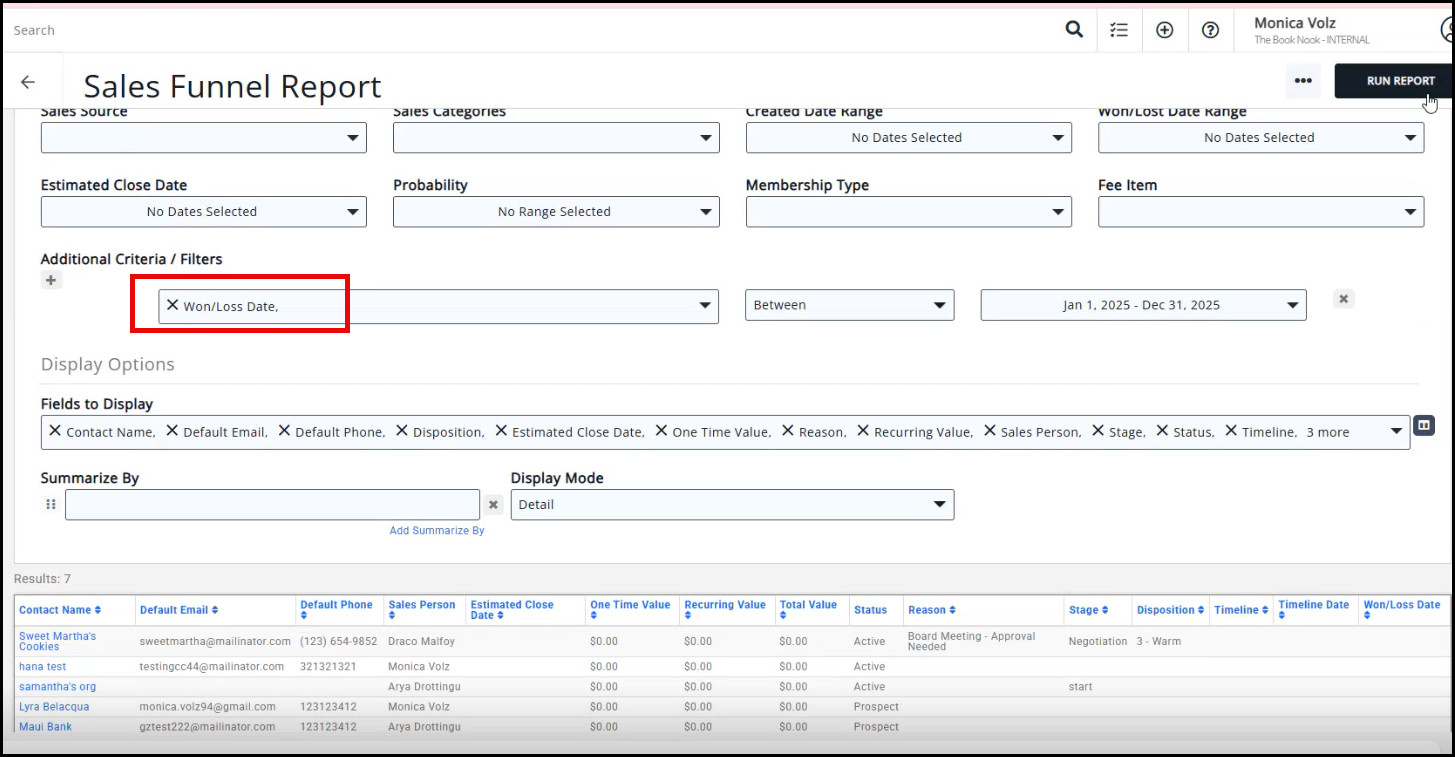
- You will use the Won/Loss Date in additional criteria to see the New and Won fields on the Sales Funnel Report.
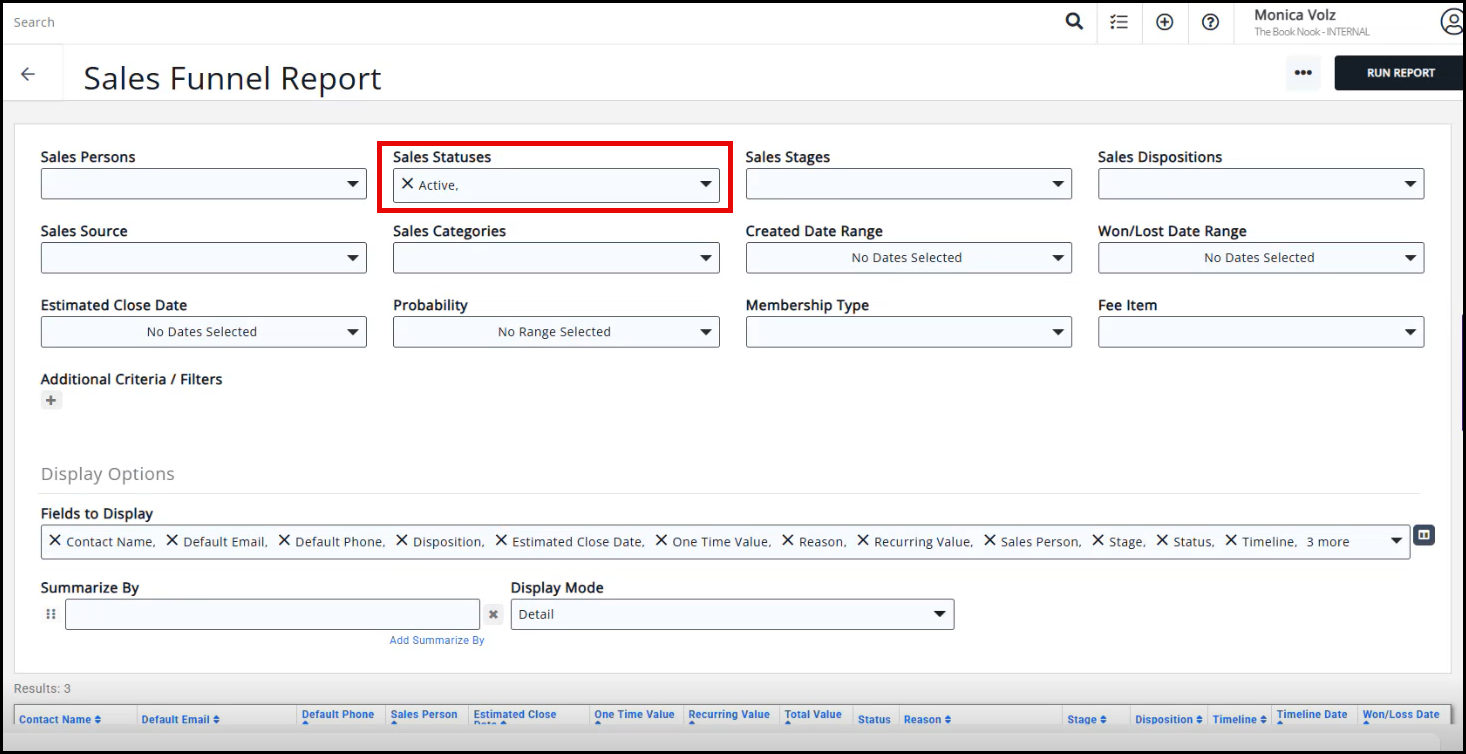
- You will use the Sales Statuses Active to see the Active field on the Sales Funnel Report.
- You will use the Won/Loss Date in additional criteria to see the New and Won fields on the Sales Funnel Report.
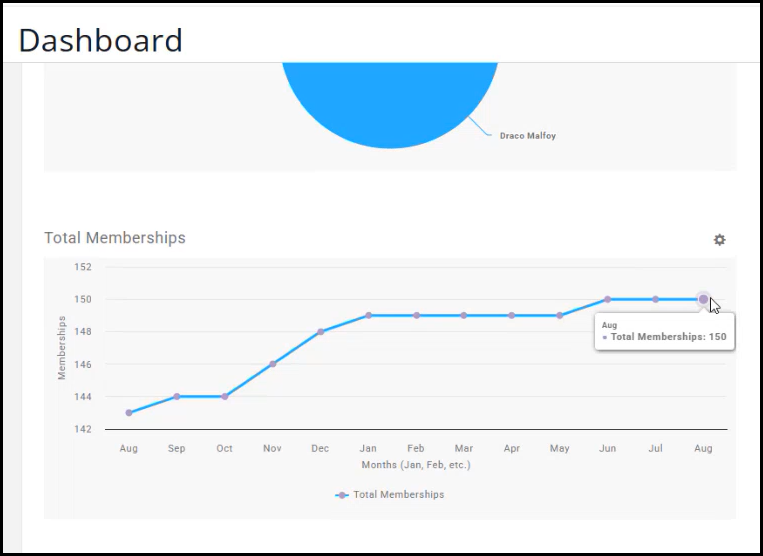
Total Memberships
-
Total Memberships statistics come from the Membership Report. If you use the gear icon on the Total Memberships widget, you can choose to include Courtesy Memberships in this statistic as well as specify the Membership Category or Membership Type.
-
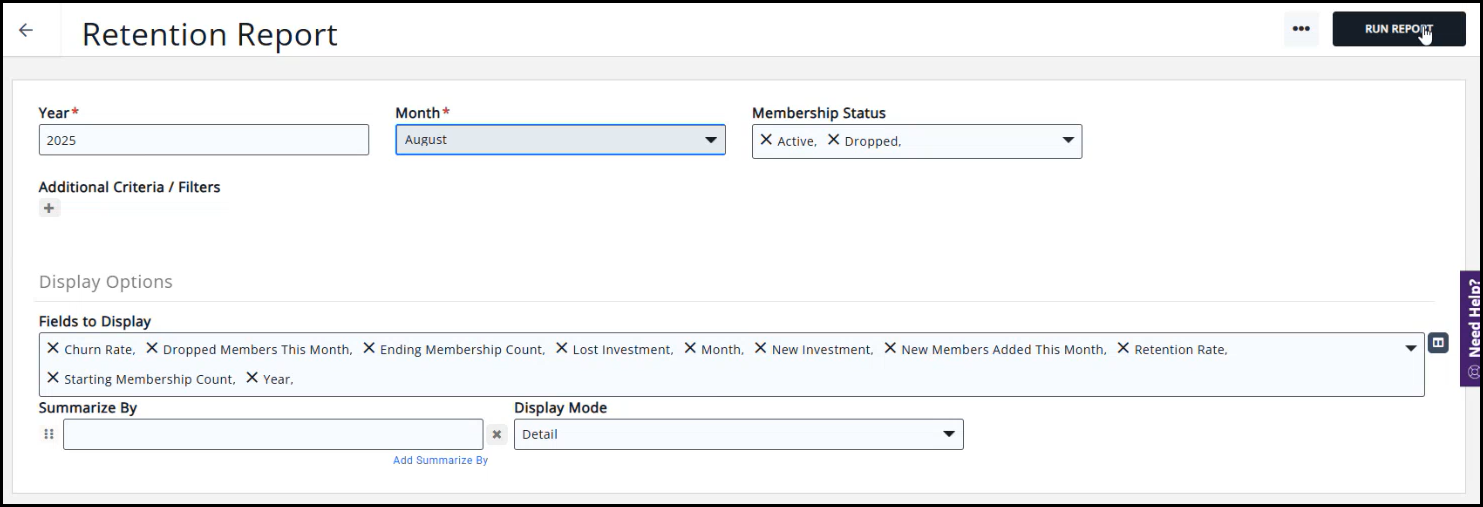
To find where the statistic you see under Total Membership comes from, you can use a Retention Report to see past membership statistics. You will set the Year, Month, and Membership Status to match the fields you have set on your Total Membership widget.
Wins by Sales Person
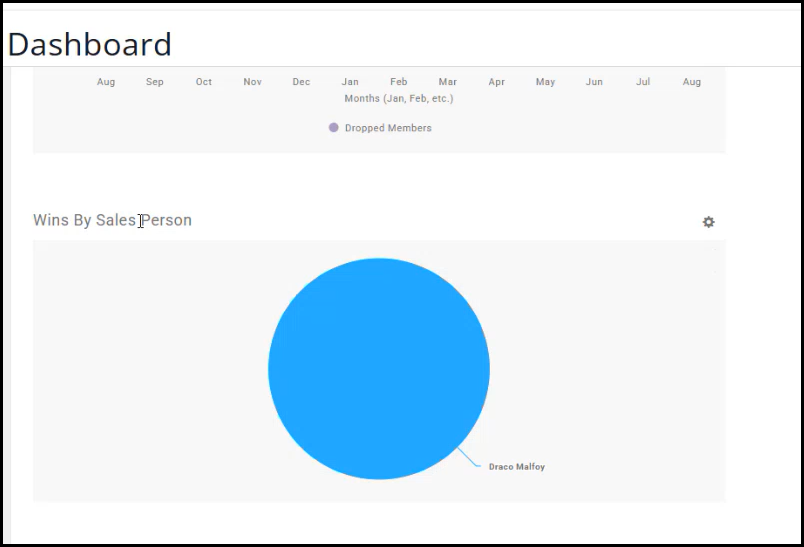
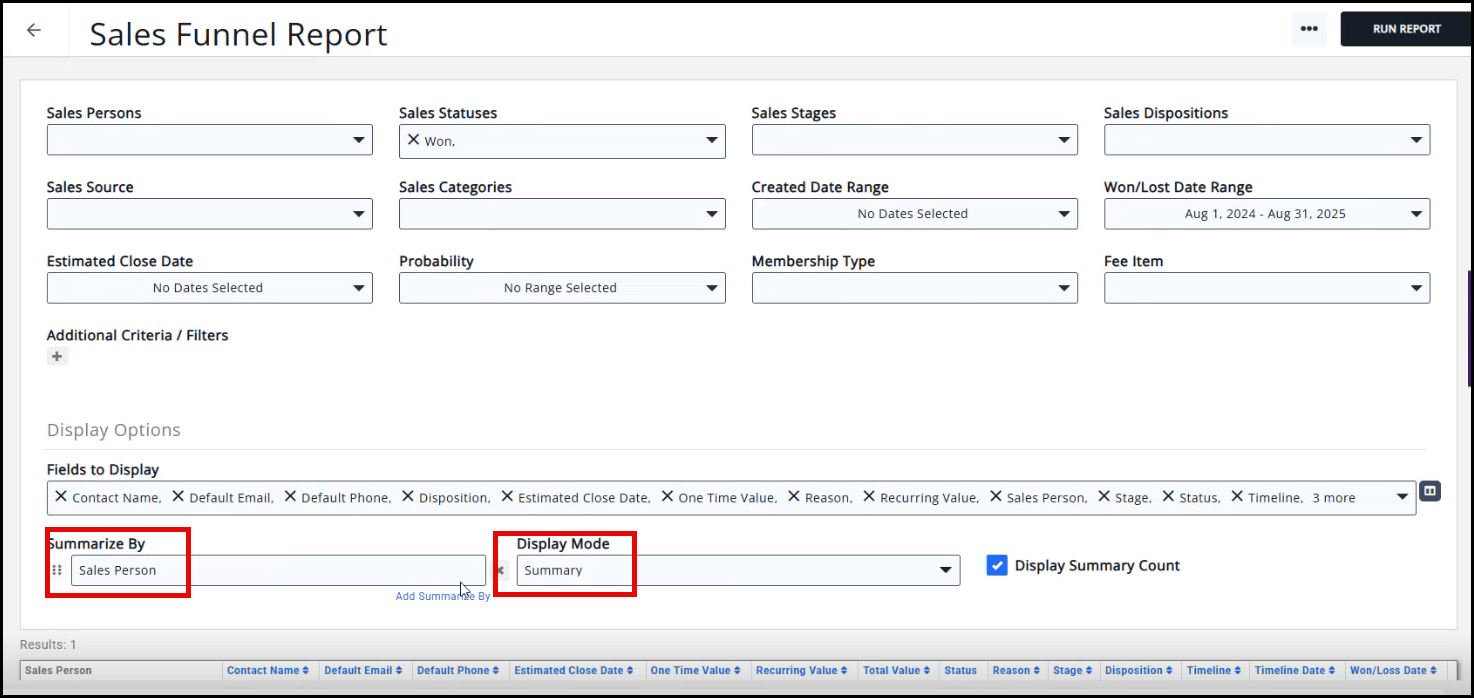
- Wins by Sales Person pulls from the Sales Funnel Report for its statistics. You will set the Status to 'Completed' and summarize by the salesperson's name to find your widget statistics. Set the Display Mode to Summary to view the items sold by the person.
Membership Categories
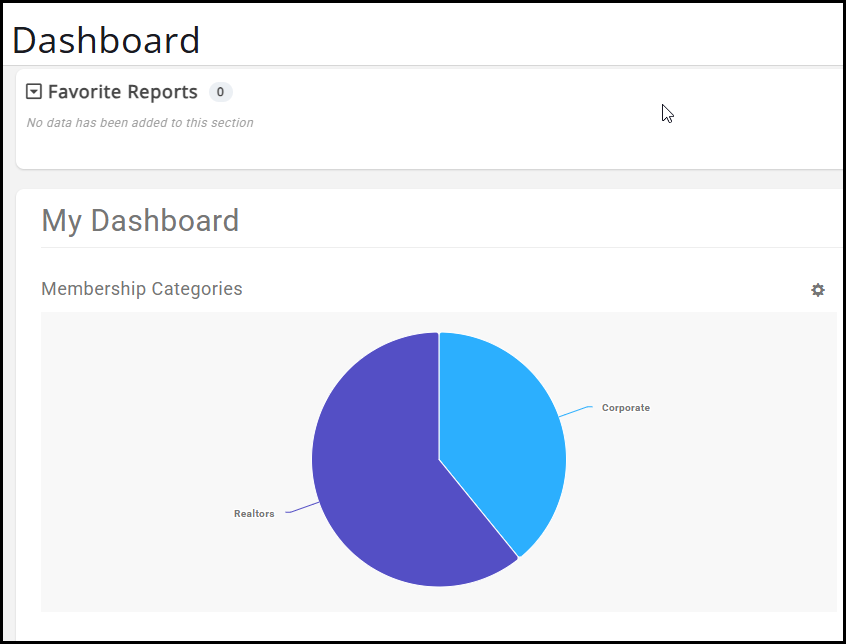
- Membership Categories displays the categories you have set up for your memberships in your database. Refer to 'Setup Membership Type Directories & Categories' to learn how to set up these membership categories.
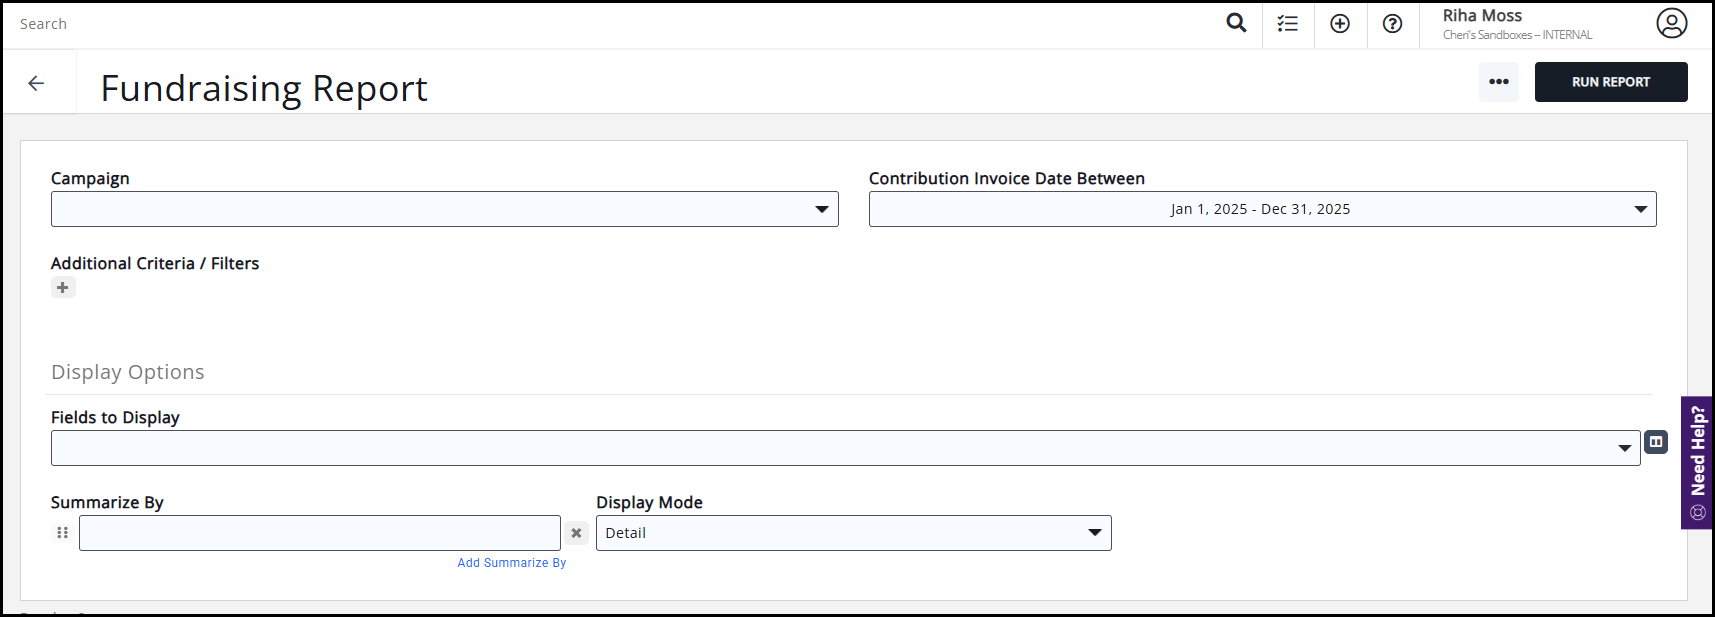
Fundraising Statistics - Current Year
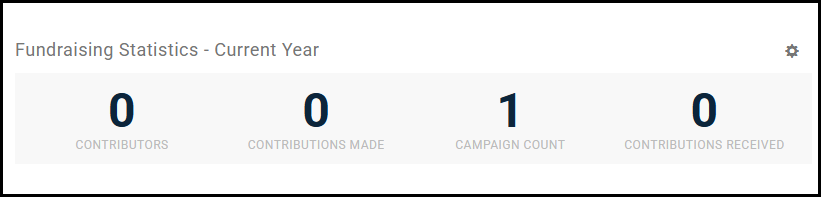
- The Fundraising Statistics uses the Fundraising Report to display the statistics on the widget. You will set the Contribution Invoice Date Between to be This Year, and you will set the Fields to Display to identify the statistic you want to find from the widget.
Sales Velocity
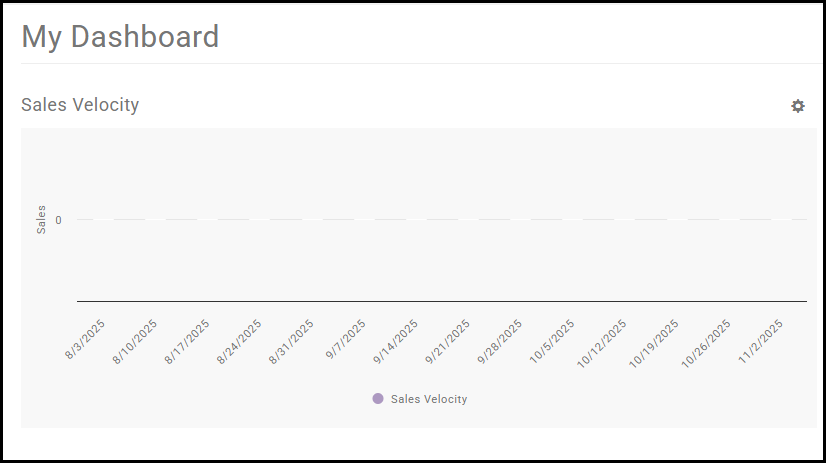
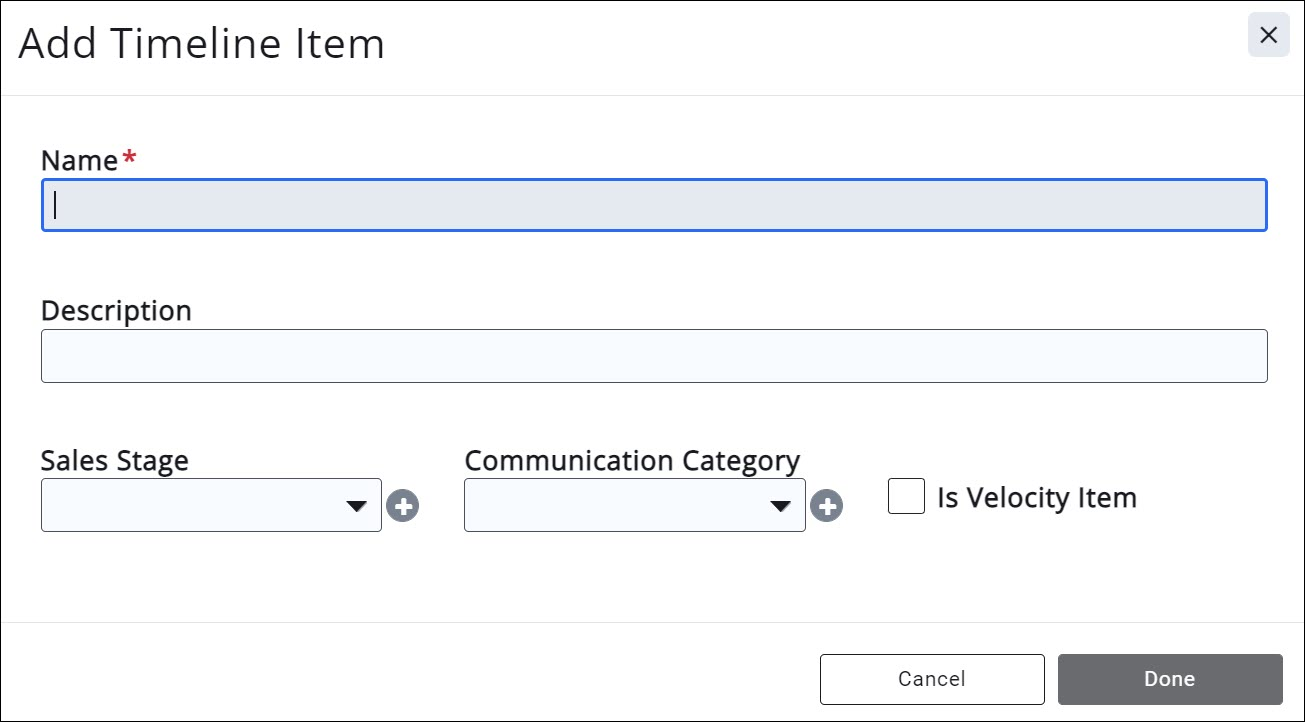
- The Sales Velocity widget sums the recurring values of sales opportunities with a timeline item marked as a velocity item over the past month, and is filtered by category. You can adjust the statistics displayed on the widget by clicking the gear icon and selecting Sales Categories, Sales Person, and Weekly/Monthly. To see how you can set up items to affect this widget, view Setup Timeline Items.
- Anything from the Sales Opportunity that is a Timeline Item included with the checkbox Is a Velocity Item, is summed with the recurring values over the past month to show the statistic in the Sales Velocity widget.